Zip Codes with the Highest Percentage of Households with Income Below $10,000 in Las Vegas, NV
RELATED REPORTS & OPTIONS
Household Income | $0-10k
Las Vegas
Compare Zip Codes
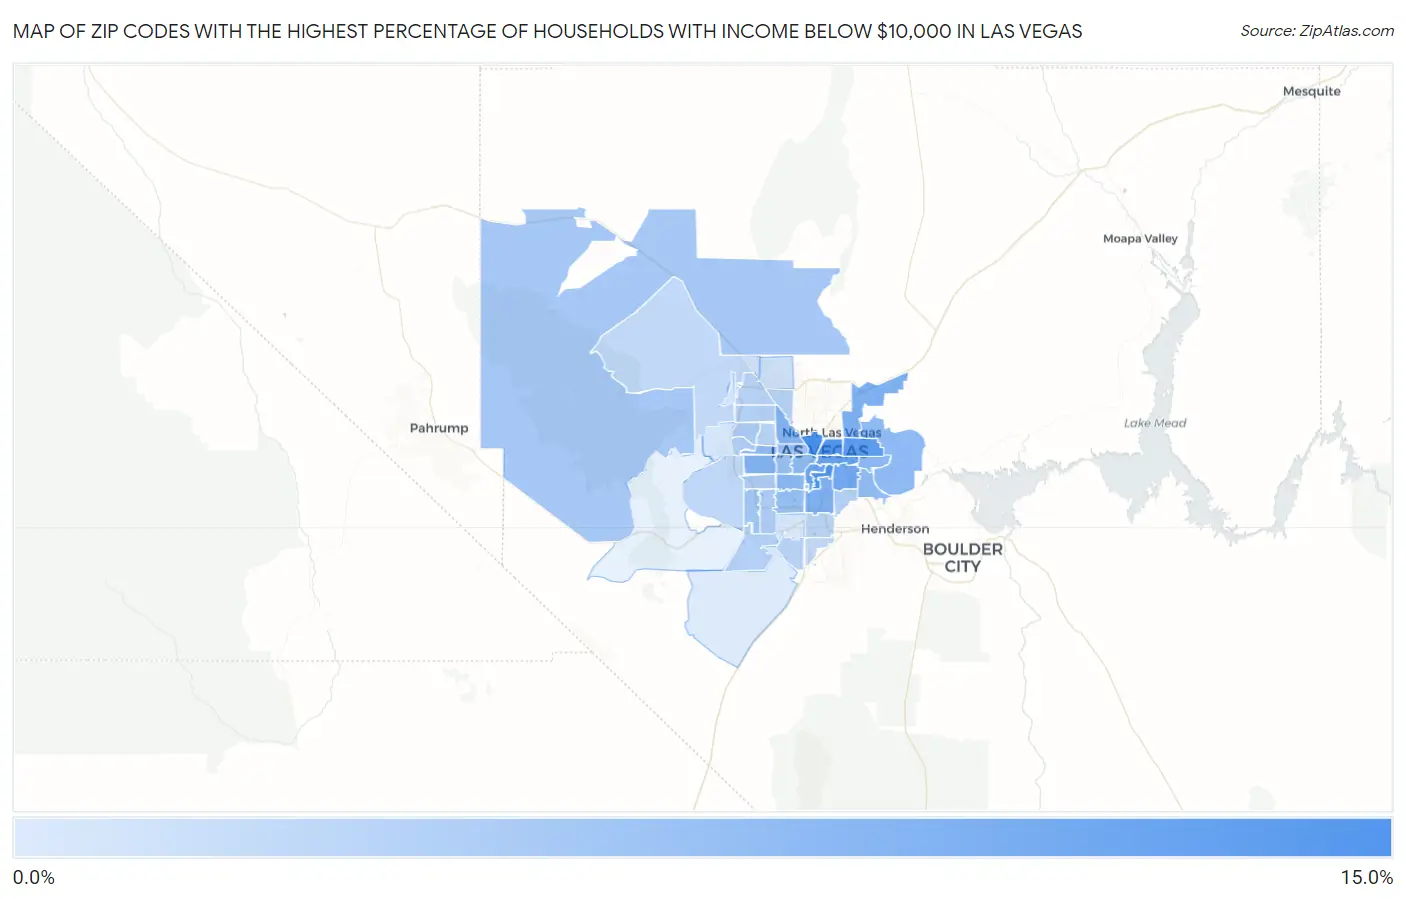
Map of Zip Codes with the Highest Percentage of Households with Income Below $10,000 in Las Vegas
0.0%
15.0%
Zip Codes with the Highest Percentage of Households with Income Below $10,000 in Las Vegas, NV
| Zip Code | Households with Income < $10k | vs State | vs National | |
| 1. | 89106 | 13.0% | 5.4%(+7.60)#11 | 4.9%(+8.10)#2,064 |
| 2. | 89169 | 12.5% | 5.4%(+7.10)#13 | 4.9%(+7.60)#2,253 |
| 3. | 89101 | 12.0% | 5.4%(+6.60)#15 | 4.9%(+7.10)#2,453 |
| 4. | 89110 | 11.3% | 5.4%(+5.90)#17 | 4.9%(+6.40)#2,781 |
| 5. | 89104 | 10.4% | 5.4%(+5.00)#22 | 4.9%(+5.50)#3,286 |
| 6. | 89109 | 10.1% | 5.4%(+4.70)#24 | 4.9%(+5.20)#3,512 |
| 7. | 89121 | 9.4% | 5.4%(+4.00)#28 | 4.9%(+4.50)#4,024 |
| 8. | 89115 | 8.6% | 5.4%(+3.20)#29 | 4.9%(+3.70)#4,812 |
| 9. | 89119 | 8.5% | 5.4%(+3.10)#30 | 4.9%(+3.60)#4,913 |
| 10. | 89108 | 8.2% | 5.4%(+2.80)#32 | 4.9%(+3.30)#5,284 |
| 11. | 89117 | 8.1% | 5.4%(+2.70)#33 | 4.9%(+3.20)#5,407 |
| 12. | 89103 | 7.7% | 5.4%(+2.30)#34 | 4.9%(+2.80)#5,932 |
| 13. | 89142 | 7.4% | 5.4%(+2.00)#38 | 4.9%(+2.50)#6,344 |
| 14. | 89102 | 7.3% | 5.4%(+1.90)#39 | 4.9%(+2.40)#6,480 |
| 15. | 89156 | 7.2% | 5.4%(+1.80)#40 | 4.9%(+2.30)#6,634 |
| 16. | 89122 | 7.1% | 5.4%(+1.70)#41 | 4.9%(+2.20)#6,772 |
| 17. | 89145 | 7.1% | 5.4%(+1.70)#42 | 4.9%(+2.20)#6,788 |
| 18. | 89118 | 6.7% | 5.4%(+1.30)#44 | 4.9%(+1.80)#7,543 |
| 19. | 89146 | 6.6% | 5.4%(+1.20)#46 | 4.9%(+1.70)#7,734 |
| 20. | 89158 | 6.6% | 5.4%(+1.20)#48 | 4.9%(+1.70)#7,870 |
| 21. | 89107 | 6.3% | 5.4%(+0.900)#49 | 4.9%(+1.40)#8,313 |
| 22. | 89148 | 5.7% | 5.4%(+0.300)#52 | 4.9%(+0.800)#9,687 |
| 23. | 89124 | 5.4% | 5.4%(=0.000)#55 | 4.9%(+0.500)#10,669 |
| 24. | 89134 | 5.1% | 5.4%(-0.300)#57 | 4.9%(+0.200)#11,386 |
| 25. | 89147 | 4.9% | 5.4%(-0.500)#65 | 4.9%(=0.000)#11,965 |
| 26. | 89113 | 4.9% | 5.4%(-0.500)#67 | 4.9%(=0.000)#11,998 |
| 27. | 89144 | 4.7% | 5.4%(-0.700)#71 | 4.9%(-0.200)#12,697 |
| 28. | 89178 | 4.5% | 5.4%(-0.900)#75 | 4.9%(-0.400)#13,336 |
| 29. | 89129 | 4.3% | 5.4%(-1.10)#80 | 4.9%(-0.600)#14,029 |
| 30. | 89120 | 4.3% | 5.4%(-1.10)#81 | 4.9%(-0.600)#14,100 |
| 31. | 89130 | 4.2% | 5.4%(-1.20)#82 | 4.9%(-0.700)#14,473 |
| 32. | 89141 | 4.1% | 5.4%(-1.30)#85 | 4.9%(-0.800)#14,826 |
| 33. | 89149 | 4.0% | 5.4%(-1.40)#87 | 4.9%(-0.900)#15,213 |
| 34. | 89128 | 4.0% | 5.4%(-1.40)#88 | 4.9%(-0.900)#15,225 |
| 35. | 89123 | 3.9% | 5.4%(-1.50)#89 | 4.9%(-1.00)#15,583 |
| 36. | 89135 | 3.6% | 5.4%(-1.80)#93 | 4.9%(-1.30)#16,841 |
| 37. | 89183 | 3.3% | 5.4%(-2.10)#102 | 4.9%(-1.60)#18,065 |
| 38. | 89166 | 3.3% | 5.4%(-2.10)#103 | 4.9%(-1.60)#18,106 |
| 39. | 89143 | 2.4% | 5.4%(-3.00)#123 | 4.9%(-2.50)#22,110 |
| 40. | 89131 | 2.3% | 5.4%(-3.10)#125 | 4.9%(-2.60)#22,406 |
| 41. | 89138 | 1.8% | 5.4%(-3.60)#130 | 4.9%(-3.10)#24,381 |
| 42. | 89139 | 1.6% | 5.4%(-3.80)#132 | 4.9%(-3.30)#25,064 |
| 43. | 89179 | 1.3% | 5.4%(-4.10)#136 | 4.9%(-3.60)#26,060 |
1
Common Questions
What are the Top 10 Zip Codes with the Highest Percentage of Households with Income Below $10,000 in Las Vegas, NV?
Top 10 Zip Codes with the Highest Percentage of Households with Income Below $10,000 in Las Vegas, NV are:
What zip code has the Highest Percentage of Households with Income Below $10,000 in Las Vegas, NV?
89106 has the Highest Percentage of Households with Income Below $10,000 in Las Vegas, NV with 13.0%.
What is the Percentage of Households with Income Below $10,000 in Las Vegas, NV?
Percentage of Households with Income Below $10,000 in Las Vegas is 6.7%.
What is the Percentage of Households with Income Below $10,000 in Nevada?
Percentage of Households with Income Below $10,000 in Nevada is 5.4%.
What is the Percentage of Households with Income Below $10,000 in the United States?
Percentage of Households with Income Below $10,000 in the United States is 4.9%.