Zip Codes with the Highest Percentage of Population Employed in Life, Physical & Social Science in Las Vegas, NV
RELATED REPORTS & OPTIONS
Life, Physical & Social Science
Las Vegas
Compare Zip Codes
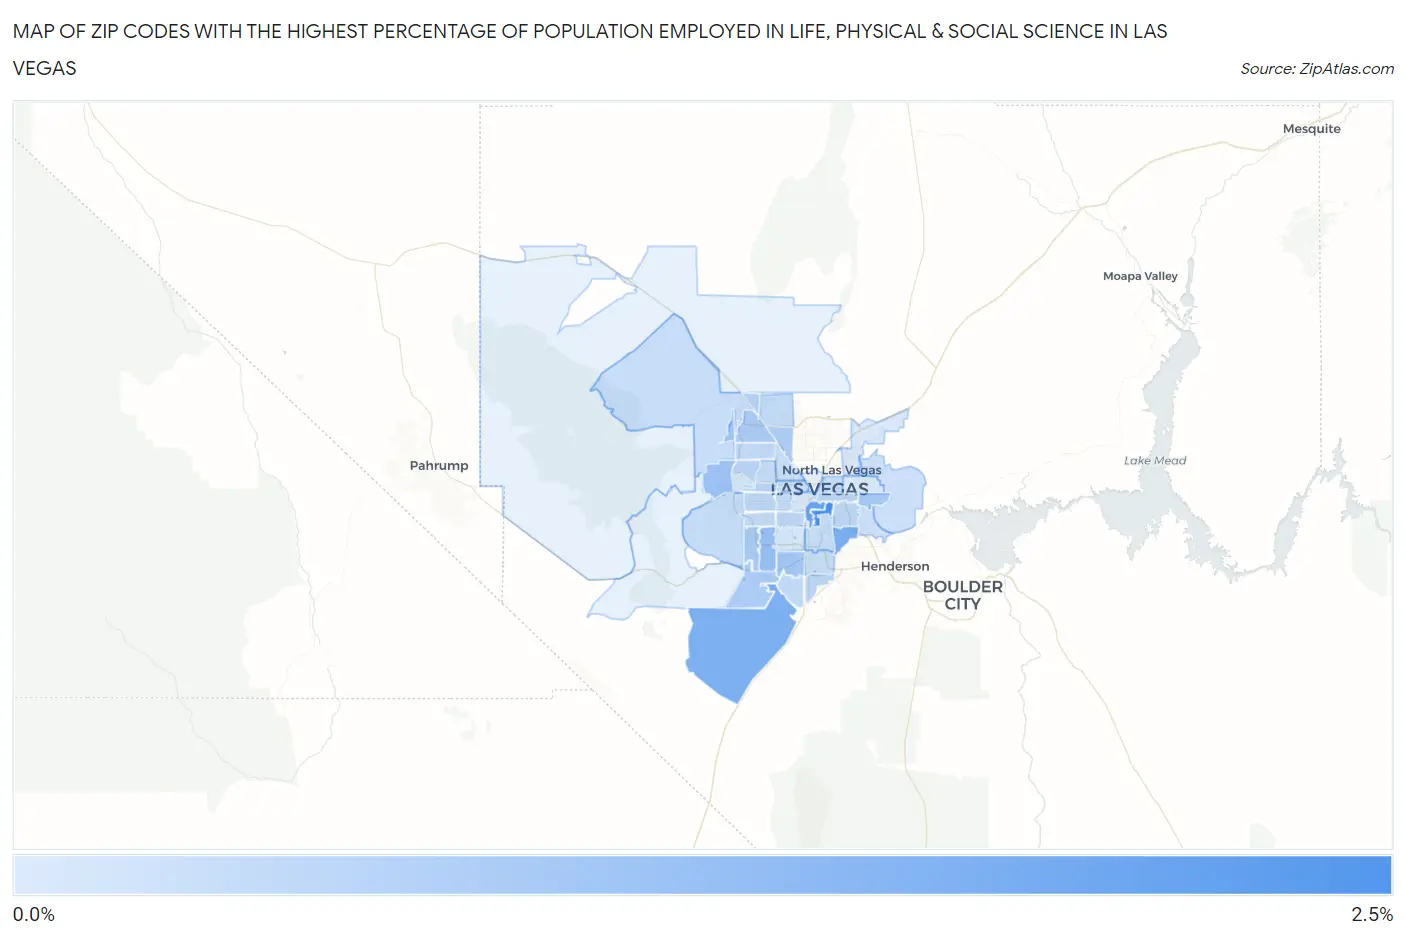
Map of Zip Codes with the Highest Percentage of Population Employed in Life, Physical & Social Science in Las Vegas
0.0%
2.5%
Zip Codes with the Highest Percentage of Population Employed in Life, Physical & Social Science in Las Vegas, NV
| Zip Code | % Employed | vs State | vs National | |
| 1. | 89169 | 2.0% | 0.68%(+1.35)#19 | 1.1%(+0.937)#3,603 |
| 2. | 89109 | 1.6% | 0.68%(+0.933)#26 | 1.1%(+0.521)#5,106 |
| 3. | 89120 | 1.3% | 0.68%(+0.664)#32 | 1.1%(+0.252)#6,511 |
| 4. | 89179 | 1.3% | 0.68%(+0.661)#33 | 1.1%(+0.249)#6,532 |
| 5. | 89113 | 0.98% | 0.68%(+0.298)#36 | 1.1%(-0.114)#9,260 |
| 6. | 89138 | 0.93% | 0.68%(+0.254)#37 | 1.1%(-0.158)#9,639 |
| 7. | 89139 | 0.80% | 0.68%(+0.122)#42 | 1.1%(-0.290)#10,987 |
| 8. | 89148 | 0.76% | 0.68%(+0.084)#45 | 1.1%(-0.328)#11,365 |
| 9. | 89142 | 0.75% | 0.68%(+0.070)#46 | 1.1%(-0.342)#11,527 |
| 10. | 89178 | 0.70% | 0.68%(+0.017)#51 | 1.1%(-0.395)#12,089 |
| 11. | 89149 | 0.69% | 0.68%(+0.012)#52 | 1.1%(-0.400)#12,151 |
| 12. | 89130 | 0.66% | 0.68%(-0.017)#53 | 1.1%(-0.429)#12,505 |
| 13. | 89143 | 0.58% | 0.68%(-0.098)#57 | 1.1%(-0.510)#13,536 |
| 14. | 89134 | 0.51% | 0.68%(-0.165)#62 | 1.1%(-0.577)#14,338 |
| 15. | 89145 | 0.50% | 0.68%(-0.176)#63 | 1.1%(-0.588)#14,466 |
| 16. | 89103 | 0.49% | 0.68%(-0.187)#64 | 1.1%(-0.599)#14,612 |
| 17. | 89183 | 0.47% | 0.68%(-0.213)#67 | 1.1%(-0.625)#14,949 |
| 18. | 89104 | 0.46% | 0.68%(-0.216)#68 | 1.1%(-0.628)#14,985 |
| 19. | 89117 | 0.44% | 0.68%(-0.240)#70 | 1.1%(-0.652)#15,274 |
| 20. | 89121 | 0.44% | 0.68%(-0.242)#71 | 1.1%(-0.654)#15,306 |
| 21. | 89141 | 0.39% | 0.68%(-0.291)#73 | 1.1%(-0.704)#15,925 |
| 22. | 89146 | 0.38% | 0.68%(-0.294)#74 | 1.1%(-0.706)#15,950 |
| 23. | 89147 | 0.38% | 0.68%(-0.298)#75 | 1.1%(-0.710)#15,992 |
| 24. | 89129 | 0.38% | 0.68%(-0.303)#77 | 1.1%(-0.715)#16,067 |
| 25. | 89131 | 0.37% | 0.68%(-0.309)#78 | 1.1%(-0.721)#16,138 |
| 26. | 89128 | 0.36% | 0.68%(-0.319)#79 | 1.1%(-0.731)#16,284 |
| 27. | 89135 | 0.34% | 0.68%(-0.336)#81 | 1.1%(-0.748)#16,494 |
| 28. | 89119 | 0.34% | 0.68%(-0.336)#82 | 1.1%(-0.748)#16,498 |
| 29. | 89166 | 0.33% | 0.68%(-0.350)#83 | 1.1%(-0.762)#16,679 |
| 30. | 89123 | 0.33% | 0.68%(-0.351)#84 | 1.1%(-0.763)#16,690 |
| 31. | 89101 | 0.30% | 0.68%(-0.382)#85 | 1.1%(-0.794)#17,099 |
| 32. | 89108 | 0.26% | 0.68%(-0.417)#88 | 1.1%(-0.829)#17,516 |
| 33. | 89156 | 0.26% | 0.68%(-0.418)#89 | 1.1%(-0.830)#17,523 |
| 34. | 89107 | 0.23% | 0.68%(-0.449)#90 | 1.1%(-0.862)#17,866 |
| 35. | 89122 | 0.23% | 0.68%(-0.450)#91 | 1.1%(-0.862)#17,878 |
| 36. | 89118 | 0.17% | 0.68%(-0.505)#93 | 1.1%(-0.917)#18,455 |
| 37. | 89144 | 0.14% | 0.68%(-0.534)#96 | 1.1%(-0.946)#18,732 |
| 38. | 89102 | 0.12% | 0.68%(-0.558)#97 | 1.1%(-0.970)#18,932 |
| 39. | 89115 | 0.094% | 0.68%(-0.584)#100 | 1.1%(-0.996)#19,108 |
| 40. | 89110 | 0.055% | 0.68%(-0.624)#102 | 1.1%(-1.04)#19,314 |
1
Common Questions
What are the Top 10 Zip Codes with the Highest Percentage of Population Employed in Life, Physical & Social Science in Las Vegas, NV?
Top 10 Zip Codes with the Highest Percentage of Population Employed in Life, Physical & Social Science in Las Vegas, NV are:
What zip code has the Highest Percentage of Population Employed in Life, Physical & Social Science in Las Vegas, NV?
89169 has the Highest Percentage of Population Employed in Life, Physical & Social Science in Las Vegas, NV with 2.0%.
What is the Percentage of Population Employed in Life, Physical & Social Science in Las Vegas, NV?
Percentage of Population Employed in Life, Physical & Social Science in Las Vegas is 0.39%.
What is the Percentage of Population Employed in Life, Physical & Social Science in Nevada?
Percentage of Population Employed in Life, Physical & Social Science in Nevada is 0.68%.
What is the Percentage of Population Employed in Life, Physical & Social Science in the United States?
Percentage of Population Employed in Life, Physical & Social Science in the United States is 1.1%.