Zip Codes with the Highest Percentage of Households Without a Vehicle in Las Vegas, NV
RELATED REPORTS & OPTIONS
Households without a Cars
Las Vegas
Compare Zip Codes
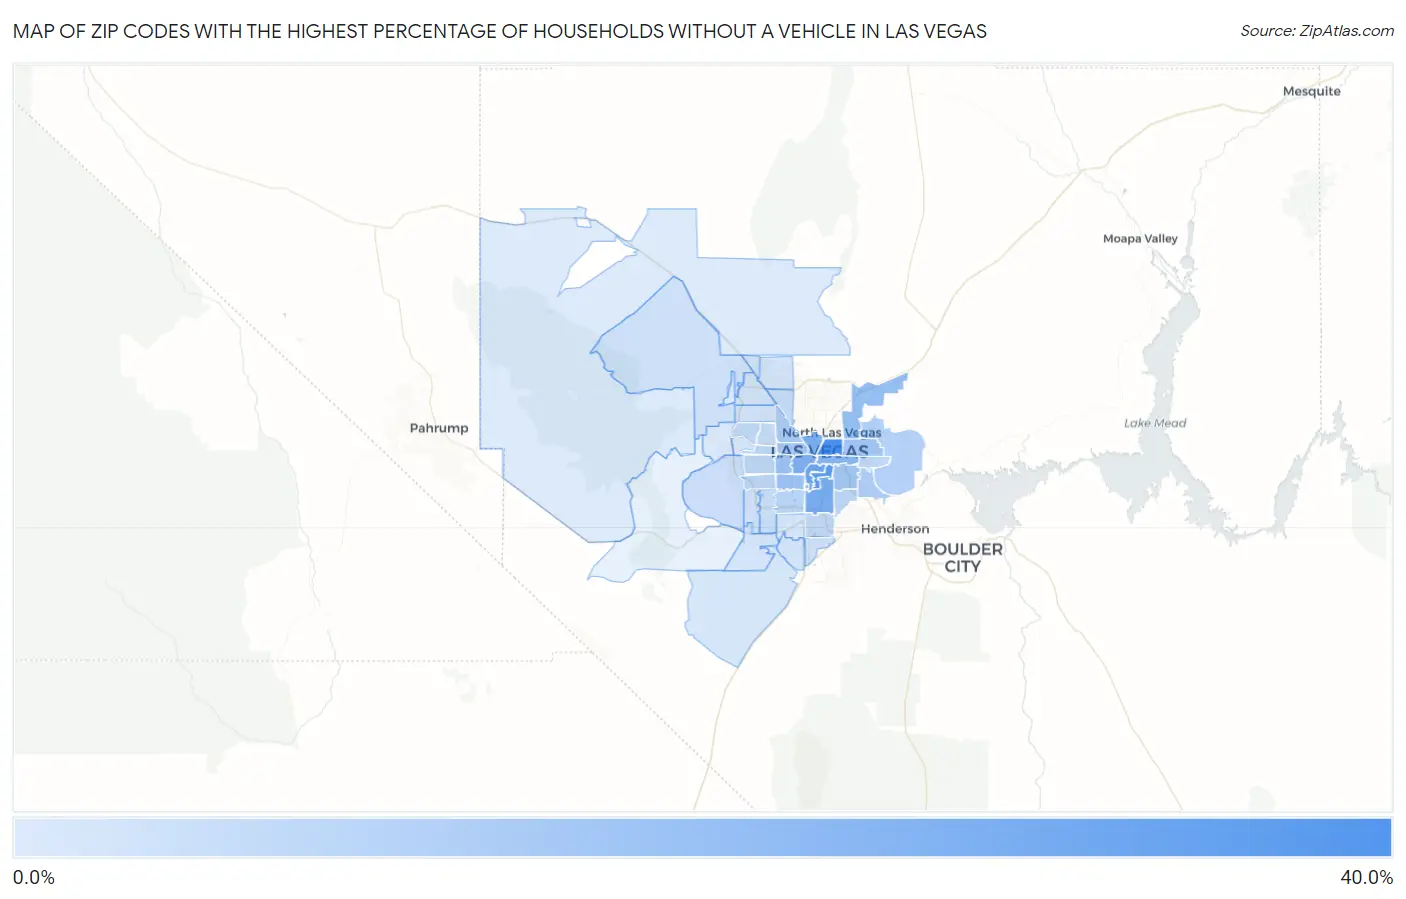
Map of Zip Codes with the Highest Percentage of Households Without a Vehicle in Las Vegas
0.0%
40.0%
Zip Codes with the Highest Percentage of Households Without a Vehicle in Las Vegas, NV
| Zip Code | Housholds Without a Car | vs State | vs National | |
| 1. | 89101 | 32.3% | 7.1%(+25.2)#3 | 8.3%(+24.0)#718 |
| 2. | 89169 | 26.9% | 7.1%(+19.8)#5 | 8.3%(+18.6)#945 |
| 3. | 89109 | 23.8% | 7.1%(+16.7)#7 | 8.3%(+15.5)#1,154 |
| 4. | 89119 | 20.8% | 7.1%(+13.7)#8 | 8.3%(+12.5)#1,406 |
| 5. | 89106 | 19.8% | 7.1%(+12.7)#9 | 8.3%(+11.5)#1,524 |
| 6. | 89102 | 19.6% | 7.1%(+12.5)#11 | 8.3%(+11.3)#1,550 |
| 7. | 89158 | 18.8% | 7.1%(+11.7)#12 | 8.3%(+10.5)#1,676 |
| 8. | 89104 | 17.2% | 7.1%(+10.1)#15 | 8.3%(+8.90)#1,910 |
| 9. | 89115 | 14.5% | 7.1%(+7.40)#20 | 8.3%(+6.20)#2,517 |
| 10. | 89103 | 13.4% | 7.1%(+6.30)#22 | 8.3%(+5.10)#2,911 |
| 11. | 89146 | 13.1% | 7.1%(+6.00)#24 | 8.3%(+4.80)#3,057 |
| 12. | 89121 | 11.6% | 7.1%(+4.50)#26 | 8.3%(+3.30)#3,748 |
| 13. | 89110 | 11.5% | 7.1%(+4.40)#27 | 8.3%(+3.20)#3,815 |
| 14. | 89107 | 11.3% | 7.1%(+4.20)#28 | 8.3%(+3.00)#3,935 |
| 15. | 89108 | 10.0% | 7.1%(+2.90)#30 | 8.3%(+1.70)#4,834 |
| 16. | 89122 | 9.0% | 7.1%(+1.90)#31 | 8.3%(+0.700)#5,721 |
| 17. | 89156 | 8.3% | 7.1%(+1.20)#35 | 8.3%(=0.000)#6,538 |
| 18. | 89118 | 6.7% | 7.1%(-0.400)#44 | 8.3%(-1.60)#9,034 |
| 19. | 89147 | 6.6% | 7.1%(-0.500)#45 | 8.3%(-1.70)#9,174 |
| 20. | 89117 | 6.4% | 7.1%(-0.700)#48 | 8.3%(-1.90)#9,552 |
| 21. | 89120 | 6.3% | 7.1%(-0.800)#49 | 8.3%(-2.00)#9,804 |
| 22. | 89142 | 6.0% | 7.1%(-1.10)#53 | 8.3%(-2.30)#10,438 |
| 23. | 89145 | 5.8% | 7.1%(-1.30)#54 | 8.3%(-2.50)#10,910 |
| 24. | 89134 | 5.8% | 7.1%(-1.30)#55 | 8.3%(-2.50)#10,918 |
| 25. | 89123 | 5.5% | 7.1%(-1.60)#58 | 8.3%(-2.80)#11,578 |
| 26. | 89128 | 5.1% | 7.1%(-2.00)#64 | 8.3%(-3.20)#12,590 |
| 27. | 89130 | 4.8% | 7.1%(-2.30)#68 | 8.3%(-3.50)#13,344 |
| 28. | 89113 | 4.1% | 7.1%(-3.00)#74 | 8.3%(-4.20)#15,379 |
| 29. | 89135 | 3.6% | 7.1%(-3.50)#77 | 8.3%(-4.70)#17,008 |
| 30. | 89183 | 3.0% | 7.1%(-4.10)#87 | 8.3%(-5.30)#19,048 |
| 31. | 89148 | 2.8% | 7.1%(-4.30)#93 | 8.3%(-5.50)#19,722 |
| 32. | 89166 | 2.7% | 7.1%(-4.40)#98 | 8.3%(-5.60)#20,101 |
| 33. | 89129 | 2.5% | 7.1%(-4.60)#101 | 8.3%(-5.80)#20,712 |
| 34. | 89149 | 2.4% | 7.1%(-4.70)#104 | 8.3%(-5.90)#21,032 |
| 35. | 89143 | 2.3% | 7.1%(-4.80)#105 | 8.3%(-6.00)#21,429 |
| 36. | 89131 | 2.1% | 7.1%(-5.00)#107 | 8.3%(-6.20)#22,039 |
| 37. | 89178 | 2.0% | 7.1%(-5.10)#111 | 8.3%(-6.30)#22,430 |
| 38. | 89141 | 2.0% | 7.1%(-5.10)#112 | 8.3%(-6.30)#22,432 |
| 39. | 89144 | 1.7% | 7.1%(-5.40)#116 | 8.3%(-6.60)#23,464 |
| 40. | 89179 | 1.7% | 7.1%(-5.40)#118 | 8.3%(-6.60)#23,493 |
| 41. | 89139 | 1.4% | 7.1%(-5.70)#120 | 8.3%(-6.90)#24,403 |
| 42. | 89138 | 0.90% | 7.1%(-6.20)#124 | 8.3%(-7.40)#25,867 |
| 43. | 89124 | 0.30% | 7.1%(-6.80)#131 | 8.3%(-8.00)#27,277 |
1
Common Questions
What are the Top 10 Zip Codes with the Highest Percentage of Households Without a Vehicle in Las Vegas, NV?
Top 10 Zip Codes with the Highest Percentage of Households Without a Vehicle in Las Vegas, NV are:
What zip code has the Highest Percentage of Households Without a Vehicle in Las Vegas, NV?
89101 has the Highest Percentage of Households Without a Vehicle in Las Vegas, NV with 32.3%.
What is the Percentage of Households Without a Vehicle in Las Vegas, NV?
Percentage of Households Without a Vehicle in Las Vegas is 9.5%.
What is the Percentage of Households Without a Vehicle in Nevada?
Percentage of Households Without a Vehicle in Nevada is 7.1%.
What is the Percentage of Households Without a Vehicle in the United States?
Percentage of Households Without a Vehicle in the United States is 8.3%.