Zip Codes with the Highest Percentage of Population Employed in Health Diagnosing & Treating in Las Vegas, NV
RELATED REPORTS & OPTIONS
Health Diagnosing & Treating
Las Vegas
Compare Zip Codes
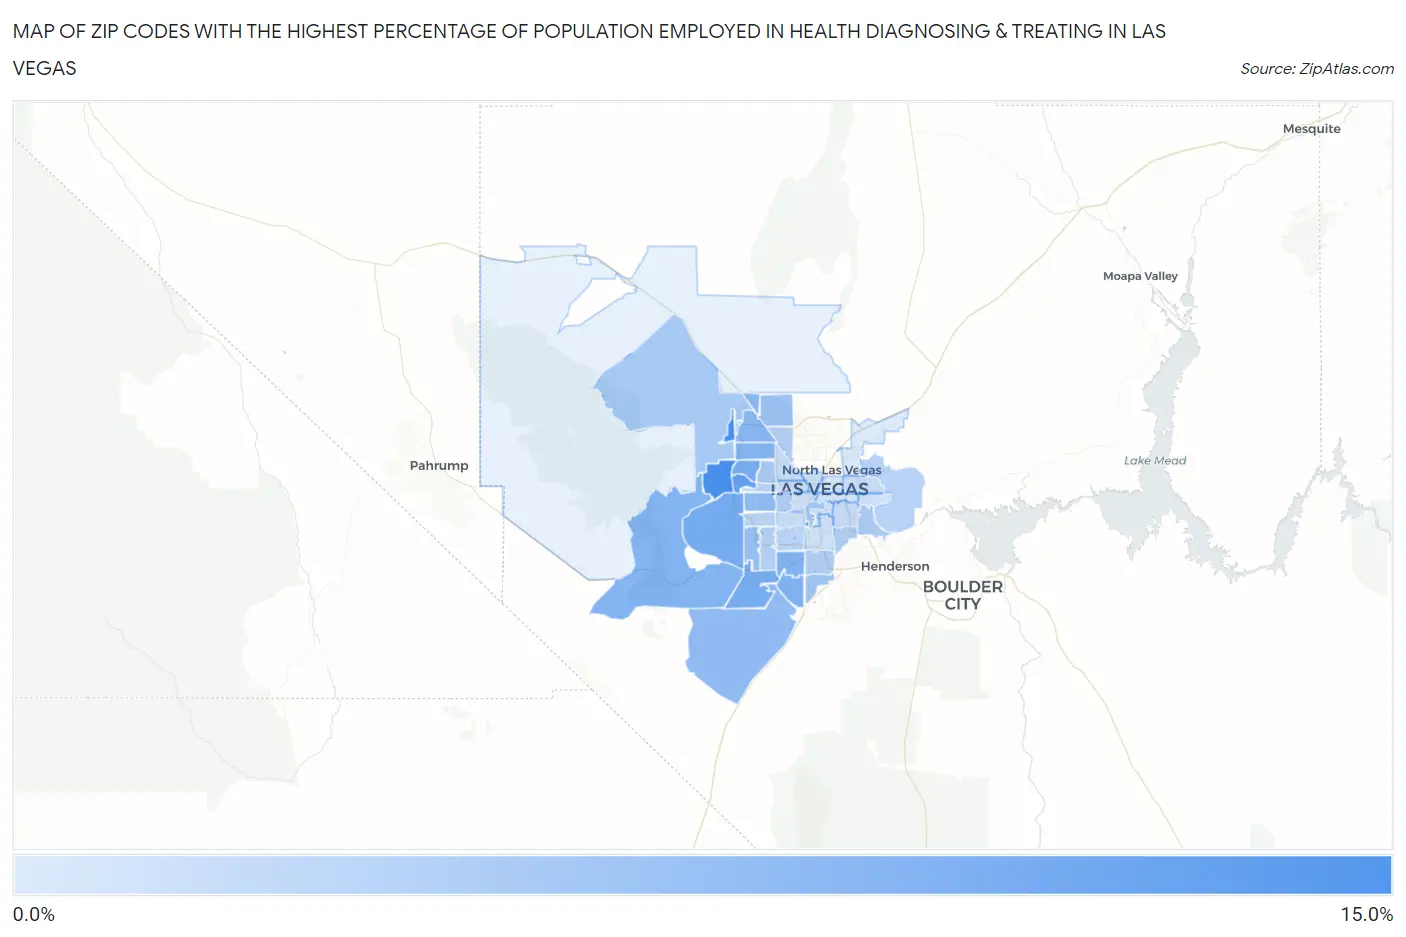
Map of Zip Codes with the Highest Percentage of Population Employed in Health Diagnosing & Treating in Las Vegas
0.0%
15.0%
Zip Codes with the Highest Percentage of Population Employed in Health Diagnosing & Treating in Las Vegas, NV
| Zip Code | % Employed | vs State | vs National | |
| 1. | 89138 | 13.0% | 4.9%(+8.08)#6 | 6.2%(+6.75)#1,741 |
| 2. | 89158 | 11.6% | 4.9%(+6.69)#9 | 6.2%(+5.36)#2,448 |
| 3. | 89144 | 10.7% | 4.9%(+5.74)#11 | 6.2%(+4.41)#3,178 |
| 4. | 89135 | 9.3% | 4.9%(+4.40)#12 | 6.2%(+3.06)#4,847 |
| 5. | 89178 | 9.1% | 4.9%(+4.17)#14 | 6.2%(+2.84)#5,219 |
| 6. | 89134 | 9.1% | 4.9%(+4.17)#15 | 6.2%(+2.83)#5,230 |
| 7. | 89141 | 8.3% | 4.9%(+3.35)#21 | 6.2%(+2.02)#6,861 |
| 8. | 89161 | 8.2% | 4.9%(+3.30)#22 | 6.2%(+1.96)#6,992 |
| 9. | 89139 | 8.1% | 4.9%(+3.16)#23 | 6.2%(+1.83)#7,320 |
| 10. | 89129 | 8.0% | 4.9%(+3.07)#25 | 6.2%(+1.74)#7,552 |
| 11. | 89149 | 7.6% | 4.9%(+2.72)#29 | 6.2%(+1.38)#8,437 |
| 12. | 89143 | 7.6% | 4.9%(+2.69)#31 | 6.2%(+1.36)#8,514 |
| 13. | 89179 | 7.1% | 4.9%(+2.16)#35 | 6.2%(+0.830)#10,118 |
| 14. | 89117 | 6.8% | 4.9%(+1.92)#38 | 6.2%(+0.589)#10,906 |
| 15. | 89148 | 6.6% | 4.9%(+1.64)#39 | 6.2%(+0.307)#11,845 |
| 16. | 89131 | 6.1% | 4.9%(+1.18)#42 | 6.2%(-0.152)#13,548 |
| 17. | 89183 | 5.8% | 4.9%(+0.888)#45 | 6.2%(-0.445)#14,614 |
| 18. | 89109 | 5.6% | 4.9%(+0.673)#47 | 6.2%(-0.660)#15,454 |
| 19. | 89166 | 5.3% | 4.9%(+0.342)#53 | 6.2%(-0.991)#16,735 |
| 20. | 89128 | 5.2% | 4.9%(+0.338)#54 | 6.2%(-0.995)#16,756 |
| 21. | 89122 | 4.9% | 4.9%(-0.046)#59 | 6.2%(-1.38)#18,227 |
| 22. | 89120 | 4.7% | 4.9%(-0.244)#65 | 6.2%(-1.58)#18,978 |
| 23. | 89146 | 4.6% | 4.9%(-0.349)#68 | 6.2%(-1.68)#19,397 |
| 24. | 89123 | 4.5% | 4.9%(-0.391)#69 | 6.2%(-1.72)#19,564 |
| 25. | 89113 | 4.5% | 4.9%(-0.454)#71 | 6.2%(-1.79)#19,789 |
| 26. | 89130 | 4.4% | 4.9%(-0.468)#72 | 6.2%(-1.80)#19,858 |
| 27. | 89156 | 4.0% | 4.9%(-0.925)#77 | 6.2%(-2.26)#21,410 |
| 28. | 89145 | 4.0% | 4.9%(-0.932)#78 | 6.2%(-2.26)#21,431 |
| 29. | 89147 | 3.9% | 4.9%(-1.00)#79 | 6.2%(-2.34)#21,662 |
| 30. | 89118 | 3.9% | 4.9%(-1.01)#80 | 6.2%(-2.34)#21,678 |
| 31. | 89121 | 3.0% | 4.9%(-1.89)#96 | 6.2%(-3.22)#24,250 |
| 32. | 89108 | 2.9% | 4.9%(-2.05)#98 | 6.2%(-3.38)#24,677 |
| 33. | 89103 | 2.7% | 4.9%(-2.20)#100 | 6.2%(-3.53)#25,011 |
| 34. | 89106 | 2.6% | 4.9%(-2.31)#103 | 6.2%(-3.64)#25,258 |
| 35. | 89110 | 2.6% | 4.9%(-2.32)#104 | 6.2%(-3.65)#25,293 |
| 36. | 89102 | 2.4% | 4.9%(-2.51)#106 | 6.2%(-3.84)#25,728 |
| 37. | 89107 | 2.4% | 4.9%(-2.53)#107 | 6.2%(-3.86)#25,773 |
| 38. | 89119 | 2.4% | 4.9%(-2.56)#109 | 6.2%(-3.89)#25,814 |
| 39. | 89142 | 2.2% | 4.9%(-2.71)#111 | 6.2%(-4.04)#26,115 |
| 40. | 89104 | 1.9% | 4.9%(-2.98)#116 | 6.2%(-4.31)#26,565 |
| 41. | 89169 | 1.9% | 4.9%(-3.02)#118 | 6.2%(-4.35)#26,644 |
| 42. | 89101 | 1.6% | 4.9%(-3.27)#120 | 6.2%(-4.60)#27,018 |
| 43. | 89115 | 1.3% | 4.9%(-3.64)#124 | 6.2%(-4.98)#27,498 |
1
Common Questions
What are the Top 10 Zip Codes with the Highest Percentage of Population Employed in Health Diagnosing & Treating in Las Vegas, NV?
Top 10 Zip Codes with the Highest Percentage of Population Employed in Health Diagnosing & Treating in Las Vegas, NV are:
What zip code has the Highest Percentage of Population Employed in Health Diagnosing & Treating in Las Vegas, NV?
89138 has the Highest Percentage of Population Employed in Health Diagnosing & Treating in Las Vegas, NV with 13.0%.
What is the Percentage of Population Employed in Health Diagnosing & Treating in Las Vegas, NV?
Percentage of Population Employed in Health Diagnosing & Treating in Las Vegas is 5.2%.
What is the Percentage of Population Employed in Health Diagnosing & Treating in Nevada?
Percentage of Population Employed in Health Diagnosing & Treating in Nevada is 4.9%.
What is the Percentage of Population Employed in Health Diagnosing & Treating in the United States?
Percentage of Population Employed in Health Diagnosing & Treating in the United States is 6.2%.