Zip Codes with the Highest Percentage of Population Employed in Real Estate, Rental & Leasing in Las Vegas, NV

RELATED REPORTS & OPTIONS

Real Estate, Rental & Leasing
Population
Families and Households
Female Fertility
Female Fertility (Unmarried)
Race (Community Size)
Race (Percentage)
Ancestry (Community Size)
AfghanAfricanAlaska NativeAlbanianAleutAmericanApacheArabArapahoArgentineanArmenianAssyrian / Chaldean / SyriacAustralianAustrianBangladeshiBarbadianBasqueBelgianBelizeanBhutaneseBlackfeetBolivianBrazilianBritishBritish West IndianBulgarianBurmeseCajunCambodianCanadianCape VerdeanCelticCentral AmericanCentral American IndianCherokeeCheyenneChickasawChileanChineseChippewaChoctawColombianComancheCosta RicanCreeCreekCroatianCubanCzechCzechoslovakianDanishDelawareDominicanDutchDutch West IndianEastern EuropeanEcuadorianEgyptianEnglishEstonianEthiopianEuropeanFijianFilipinoFinnishFrenchFrench American IndianFrench CanadianGermanGerman RussianGhanaianGreekGuamanian / ChamorroGuatemalanGuyaneseHaitianHonduranHopiHungarianIcelanderIndian (Asian)IndonesianInupiatIranianIraqiIrishIroquoisIsraeliItalianJamaicanJapaneseJordanianKenyanKoreanLaotianLatvianLebaneseLiberianLithuanianLuxembourgerMacedonianMalaysianMalteseMenomineeMexicanMexican American IndianMongolianMoroccanNative HawaiianNavajoNew ZealanderNicaraguanNigerianNorthern EuropeanNorwegianOkinawanOsagePaiutePakistaniPalestinianPanamanianParaguayanPennsylvania GermanPeruvianPimaPolishPortuguesePotawatomiPuebloPuerto RicanPuget Sound SalishRomanianRussianSalvadoranSamoanScandinavianScotch-IrishScottishSeminoleSenegaleseSerbianShoshoneSierra LeoneanSiouxSlavicSlovakSloveneSomaliSouth AfricanSouth AmericanSouth American IndianSoviet UnionSpaniardSpanishSpanish AmericanSpanish American IndianSri LankanSubsaharan AfricanSudaneseSwedishSwissSyrianThaiTlingit-HaidaTohono O'OdhamTonganTrinidadian and TobagonianTurkishU.S. Virgin IslanderUgandanUkrainianUruguayanUteVenezuelanVietnameseWelshWest IndianYaquiYugoslavianYumanYup'ikZimbabwean
Ancestry (Percentage)
AfghanAfricanAlaska NativeAlbanianAleutAmericanApacheArabArapahoArgentineanArmenianAssyrian / Chaldean / SyriacAustralianAustrianBangladeshiBarbadianBasqueBelgianBelizeanBhutaneseBlackfeetBolivianBrazilianBritishBritish West IndianBulgarianBurmeseCajunCambodianCanadianCape VerdeanCelticCentral AmericanCentral American IndianCherokeeCheyenneChickasawChileanChineseChippewaChoctawColombianComancheCosta RicanCreeCreekCroatianCubanCzechCzechoslovakianDanishDelawareDominicanDutchDutch West IndianEastern EuropeanEcuadorianEgyptianEnglishEstonianEthiopianEuropeanFijianFilipinoFinnishFrenchFrench American IndianFrench CanadianGermanGerman RussianGhanaianGreekGuamanian / ChamorroGuatemalanGuyaneseHaitianHonduranHopiHungarianIcelanderIndian (Asian)IndonesianInupiatIranianIraqiIrishIroquoisIsraeliItalianJamaicanJapaneseJordanianKenyanKoreanLaotianLatvianLebaneseLiberianLithuanianLuxembourgerMacedonianMalaysianMalteseMenomineeMexicanMexican American IndianMongolianMoroccanNative HawaiianNavajoNew ZealanderNicaraguanNigerianNorthern EuropeanNorwegianOkinawanOsagePaiutePakistaniPalestinianPanamanianParaguayanPennsylvania GermanPeruvianPimaPolishPortuguesePotawatomiPuebloPuerto RicanPuget Sound SalishRomanianRussianSalvadoranSamoanScandinavianScotch-IrishScottishSeminoleSenegaleseSerbianShoshoneSierra LeoneanSiouxSlavicSlovakSloveneSomaliSouth AfricanSouth AmericanSouth American IndianSoviet UnionSpaniardSpanishSpanish AmericanSpanish American IndianSri LankanSubsaharan AfricanSudaneseSwedishSwissSyrianThaiTlingit-HaidaTohono O'OdhamTonganTrinidadian and TobagonianTurkishU.S. Virgin IslanderUgandanUkrainianUruguayanUteVenezuelanVietnameseWelshWest IndianYaquiYugoslavianYumanYup'ikZimbabwean
Immigrant Origin (Total)
AfghanistanAfricaAlbaniaArgentinaArmeniaAsiaAustraliaAustriaBahamasBangladeshBarbadosBelarusBelgiumBelizeBoliviaBosnia and HerzegovinaBrazilBulgariaBurma / MyanmarCambodiaCameroonCanadaCaribbeanCentral AmericaChileChinaColombiaCosta RicaCroatiaCubaCzechoslovakiaDenmarkDominican RepublicEastern AfricaEastern AsiaEastern EuropeEcuadorEgyptEl SalvadorEnglandEritreaEthiopiaEuropeFijiFranceGermanyGhanaGreeceGuatemalaGuyanaHaitiHondurasHong KongHungaryIndiaIndonesiaIranIraqIrelandIsraelItalyJamaicaJapanJordanKazakhstanKenyaKoreaLaosLatin AmericaLatviaLebanonLiberiaLithuaniaMalaysiaMexicoMicronesiaMiddle AfricaMoldovaMoroccoNepalNetherlandsNicaraguaNigeriaNorth MacedoniaNorthern AfricaNorthern EuropeNorwayOceaniaPakistanPanamaPeruPhilippinesPolandPortugalRomaniaRussiaSaudi ArabiaScotlandSenegalSerbiaSierra LeoneSingaporeSomaliaSouth AfricaSouth AmericaSouth Central AsiaSouth Eastern AsiaSouthern EuropeSpainSri LankaSudanSwedenSwitzerlandSyriaTaiwanThailandTrinidad and TobagoTurkeyUgandaUkraineUruguayUzbekistanVenezuelaVietnamWest IndiesWestern AfricaWestern AsiaWestern EuropeYemenZaireZimbabwe
Immigrant Origin (Percentage)
AfghanistanAfricaAlbaniaArgentinaArmeniaAsiaAustraliaAustriaBahamasBangladeshBarbadosBelarusBelgiumBelizeBoliviaBosnia and HerzegovinaBrazilBulgariaBurma / MyanmarCambodiaCameroonCanadaCaribbeanCentral AmericaChileChinaColombiaCosta RicaCroatiaCubaCzechoslovakiaDenmarkDominican RepublicEastern AfricaEastern AsiaEastern EuropeEcuadorEgyptEl SalvadorEnglandEritreaEthiopiaEuropeFijiFranceGermanyGhanaGreeceGuatemalaGuyanaHaitiHondurasHong KongHungaryIndiaIndonesiaIranIraqIrelandIsraelItalyJamaicaJapanJordanKazakhstanKenyaKoreaLaosLatin AmericaLatviaLebanonLiberiaLithuaniaMalaysiaMexicoMicronesiaMiddle AfricaMoldovaMoroccoNepalNetherlandsNicaraguaNigeriaNorth MacedoniaNorthern AfricaNorthern EuropeNorwayOceaniaPakistanPanamaPeruPhilippinesPolandPortugalRomaniaRussiaSaudi ArabiaScotlandSenegalSerbiaSierra LeoneSingaporeSomaliaSouth AfricaSouth AmericaSouth Central AsiaSouth Eastern AsiaSouthern EuropeSpainSri LankaSudanSwedenSwitzerlandSyriaTaiwanThailandTrinidad and TobagoTurkeyUgandaUkraineUruguayUzbekistanVenezuelaVietnamWest IndiesWestern AfricaWestern AsiaWestern EuropeYemenZaireZimbabwe
Income
Income (Families)
Income (Households)
Poverty
Poverty (Families)
Unemployment
Employment Occupations
Employment Industries
Employer Class
Commute Time
Commute Means
School Enrollment
Education by Degree Field
Occupancy
Finances
Physical Characteristics
Las Vegas
Compare Zip Codes
Comparison Subject

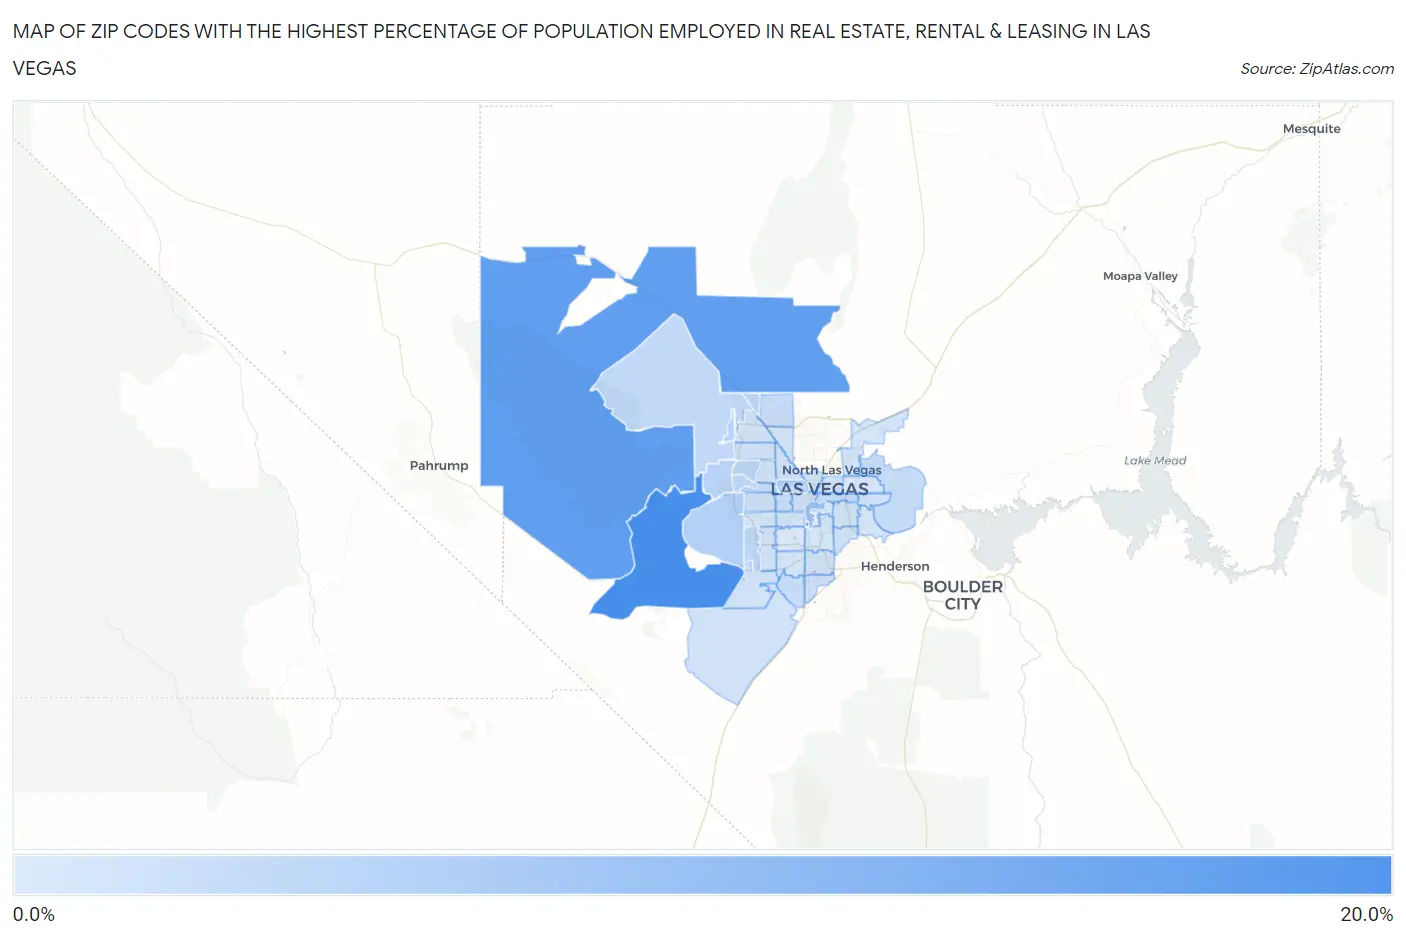
Map of Zip Codes with the Highest Percentage of Population Employed in Real Estate, Rental & Leasing in Las Vegas

0.0%
20.0%
Zip Codes with the Highest Percentage of Population Employed in Real Estate, Rental & Leasing in Las Vegas Map

Zip Codes with the Highest Percentage of Population Employed in Real Estate, Rental & Leasing in Las Vegas, NV

Zip Code % Employed vs State vs National
1.8916115.7%2.5%(+13.2)#31.9%(+13.8)#156
2.8912413.2%2.5%(+10.7)#61.9%(+11.3)#221
3.8915813.0%2.5%(+10.5)#71.9%(+11.1)#227
4.891097.8%2.5%(+5.36)#101.9%(+5.94)#579
5.891355.0%2.5%(+2.50)#151.9%(+3.08)#1,406
6.891384.5%2.5%(+2.00)#161.9%(+2.58)#1,741
7.891434.4%2.5%(+1.95)#171.9%(+2.53)#1,775
8.891344.3%2.5%(+1.81)#191.9%(+2.39)#1,878
9.891484.0%2.5%(+1.49)#231.9%(+2.07)#2,224
10.891444.0%2.5%(+1.48)#241.9%(+2.06)#2,238
11.891073.8%2.5%(+1.28)#291.9%(+1.86)#2,446
12.891663.7%2.5%(+1.24)#321.9%(+1.82)#2,496
13.891043.2%2.5%(+0.769)#351.9%(+1.35)#3,338
14.891563.2%2.5%(+0.749)#361.9%(+1.33)#3,378
15.891453.2%2.5%(+0.694)#381.9%(+1.27)#3,491
16.891313.1%2.5%(+0.602)#401.9%(+1.18)#3,698
17.891463.1%2.5%(+0.596)#411.9%(+1.17)#3,710
18.891413.0%2.5%(+0.512)#451.9%(+1.09)#3,953
19.891172.7%2.5%(+0.231)#531.9%(+0.809)#4,745
20.891832.6%2.5%(+0.105)#561.9%(+0.683)#5,190
21.891022.5%2.5%(+0.056)#581.9%(+0.634)#5,391
22.891282.5%2.5%(+0.006)#591.9%(+0.585)#5,573
23.891132.5%2.5%(-0.005)#611.9%(+0.573)#5,615
24.891292.3%2.5%(-0.188)#651.9%(+0.390)#6,393
25.891212.2%2.5%(-0.232)#711.9%(+0.347)#6,618
26.891062.2%2.5%(-0.237)#721.9%(+0.341)#6,646
27.891782.2%2.5%(-0.242)#751.9%(+0.337)#6,674
28.891492.2%2.5%(-0.257)#761.9%(+0.322)#6,746
29.891422.2%2.5%(-0.268)#771.9%(+0.310)#6,802
30.891232.2%2.5%(-0.293)#781.9%(+0.285)#6,920
31.891202.2%2.5%(-0.298)#791.9%(+0.280)#6,945
32.891792.1%2.5%(-0.332)#801.9%(+0.246)#7,124
33.891032.1%2.5%(-0.350)#821.9%(+0.229)#7,211
34.891082.1%2.5%(-0.354)#831.9%(+0.224)#7,237
35.891392.1%2.5%(-0.406)#851.9%(+0.172)#7,515
36.891012.1%2.5%(-0.414)#861.9%(+0.164)#7,559
37.891472.0%2.5%(-0.437)#881.9%(+0.142)#7,666
38.891152.0%2.5%(-0.520)#911.9%(+0.058)#8,121
39.891301.9%2.5%(-0.527)#921.9%(+0.051)#8,166
40.891191.9%2.5%(-0.573)#931.9%(+0.005)#8,490
41.891221.8%2.5%(-0.628)#951.9%(-0.050)#8,847
42.891181.5%2.5%(-1.02)#1071.9%(-0.441)#11,575
43.891101.4%2.5%(-1.09)#1091.9%(-0.512)#12,135
44.891691.2%2.5%(-1.31)#1121.9%(-0.734)#13,835

Common Questions

What are the Top 10 Zip Codes with the Highest Percentage of Population Employed in Real Estate, Rental & Leasing in Las Vegas, NV?
Top 10 Zip Codes with the Highest Percentage of Population Employed in Real Estate, Rental & Leasing in Las Vegas, NV are:
#1
15.7%
#2
13.2%
#3
13.0%
#4
7.8%
#5
5.0%
#6
4.5%
#7
4.4%
#8
4.3%
#9
4.0%
#10
4.0%
What zip code has the Highest Percentage of Population Employed in Real Estate, Rental & Leasing in Las Vegas, NV?
89161 has the Highest Percentage of Population Employed in Real Estate, Rental & Leasing in Las Vegas, NV with 15.7%.
What is the Percentage of Population Employed in Real Estate, Rental & Leasing in Las Vegas, NV?
Percentage of Population Employed in Real Estate, Rental & Leasing in Las Vegas is 2.8%.
What is the Percentage of Population Employed in Real Estate, Rental & Leasing in Nevada?
Percentage of Population Employed in Real Estate, Rental & Leasing in Nevada is 2.5%.
What is the Percentage of Population Employed in Real Estate, Rental & Leasing in the United States?
Percentage of Population Employed in Real Estate, Rental & Leasing in the United States is 1.9%.