Tecolotito, NM
Tecolotito Map
Tecolotito Overview
496
TOTAL POPULATION
131
MALE POPULATION
365
FEMALE POPULATION
35.89
MALES / 100 FEMALES
278.63
FEMALES / 100 MALES
19.3
MEDIAN AGE
3.5
AVG FAMILY SIZE
3.7
AVG HOUSEHOLD SIZE
$9,009
PER CAPITA INCOME
$33,971
AVG HOUSEHOLD INCOME
0.29
INEQUALITY / GINI INDEX
173
LABOR FORCE [ PEOPLE ]
52.9%
PERCENT IN LABOR FORCE
16.2%
UNEMPLOYMENT RATE
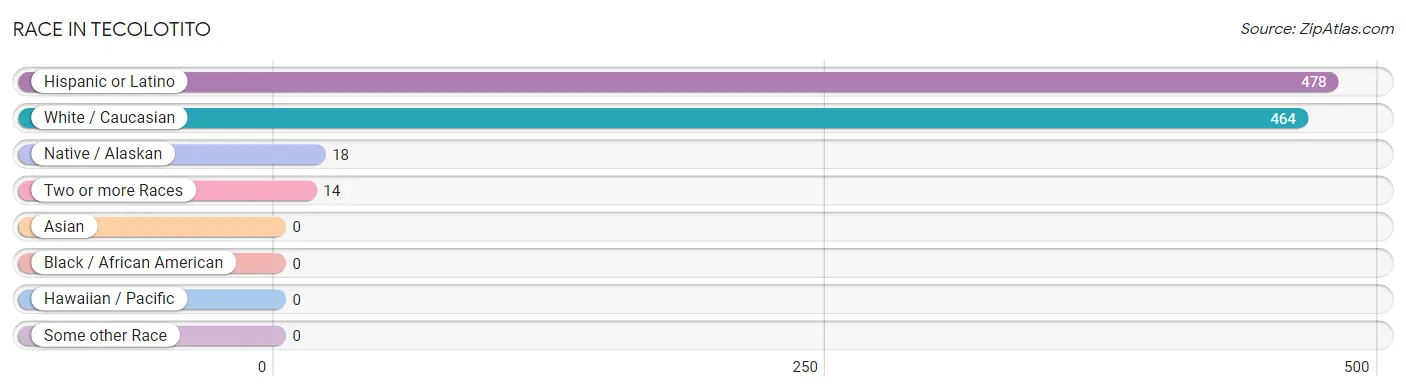
Race in Tecolotito
The most populous races in Tecolotito are Hispanic or Latino (478 | 96.4%), White / Caucasian (464 | 93.5%), and Native / Alaskan (18 | 3.6%).
| Race | # Population | % Population |
| Asian | 0 | 0.0% |
| Black / African American | 0 | 0.0% |
| Hawaiian / Pacific | 0 | 0.0% |
| Hispanic or Latino | 478 | 96.4% |
| Native / Alaskan | 18 | 3.6% |
| White / Caucasian | 464 | 93.5% |
| Two or more Races | 14 | 2.8% |
| Some other Race | 0 | 0.0% |
| Total | 496 | 100.0% |
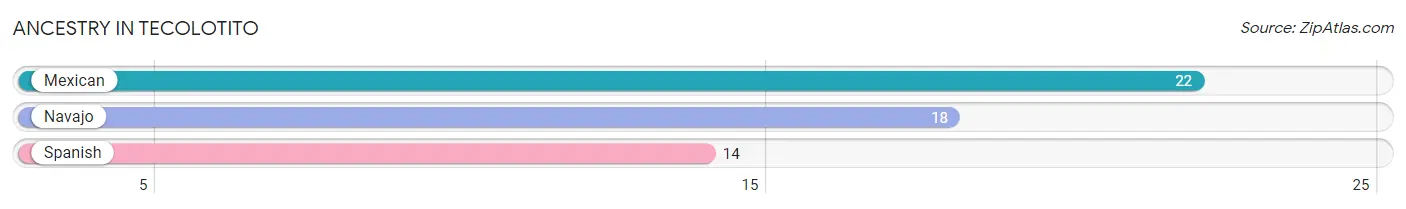
Ancestry in Tecolotito
The most populous ancestries reported in Tecolotito are Mexican (22 | 4.4%), Navajo (18 | 3.6%), and Spanish (14 | 2.8%), together accounting for 10.9% of all Tecolotito residents.
| Ancestry | # Population | % Population |
| Mexican | 22 | 4.4% |
| Navajo | 18 | 3.6% |
| Spanish | 14 | 2.8% | View All 3 Rows |
Immigrants in Tecolotito

| Immigration Origin | # Population | % Population | View All 0 Rows |
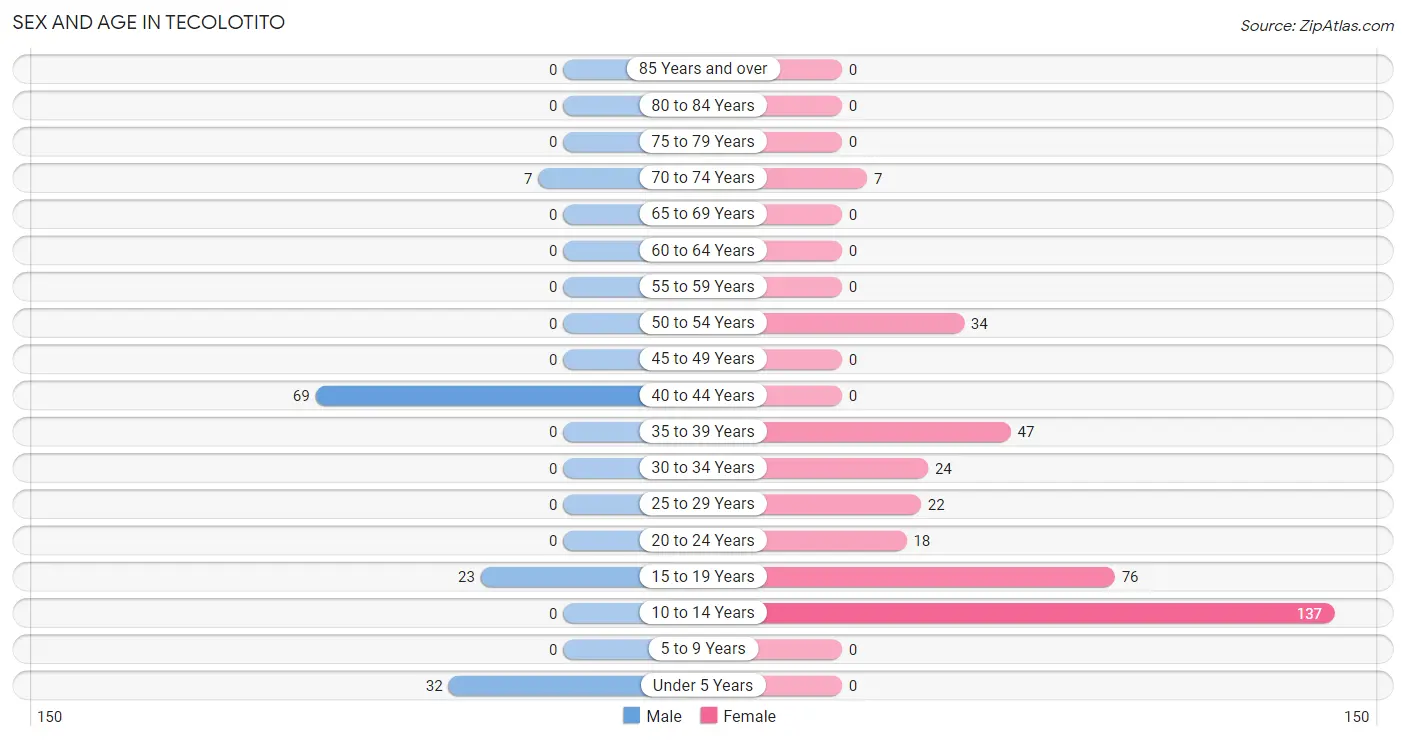
Sex and Age in Tecolotito
Sex and Age in Tecolotito
The most populous age groups in Tecolotito are 40 to 44 Years (69 | 52.7%) for men and 10 to 14 Years (137 | 37.5%) for women.
| Age Bracket | Male | Female |
| Under 5 Years | 32 (24.4%) | 0 (0.0%) |
| 5 to 9 Years | 0 (0.0%) | 0 (0.0%) |
| 10 to 14 Years | 0 (0.0%) | 137 (37.5%) |
| 15 to 19 Years | 23 (17.6%) | 76 (20.8%) |
| 20 to 24 Years | 0 (0.0%) | 18 (4.9%) |
| 25 to 29 Years | 0 (0.0%) | 22 (6.0%) |
| 30 to 34 Years | 0 (0.0%) | 24 (6.6%) |
| 35 to 39 Years | 0 (0.0%) | 47 (12.9%) |
| 40 to 44 Years | 69 (52.7%) | 0 (0.0%) |
| 45 to 49 Years | 0 (0.0%) | 0 (0.0%) |
| 50 to 54 Years | 0 (0.0%) | 34 (9.3%) |
| 55 to 59 Years | 0 (0.0%) | 0 (0.0%) |
| 60 to 64 Years | 0 (0.0%) | 0 (0.0%) |
| 65 to 69 Years | 0 (0.0%) | 0 (0.0%) |
| 70 to 74 Years | 7 (5.3%) | 7 (1.9%) |
| 75 to 79 Years | 0 (0.0%) | 0 (0.0%) |
| 80 to 84 Years | 0 (0.0%) | 0 (0.0%) |
| 85 Years and over | 0 (0.0%) | 0 (0.0%) |
| Total | 131 (100.0%) | 365 (100.0%) |
Families and Households in Tecolotito
Median Family Size in Tecolotito
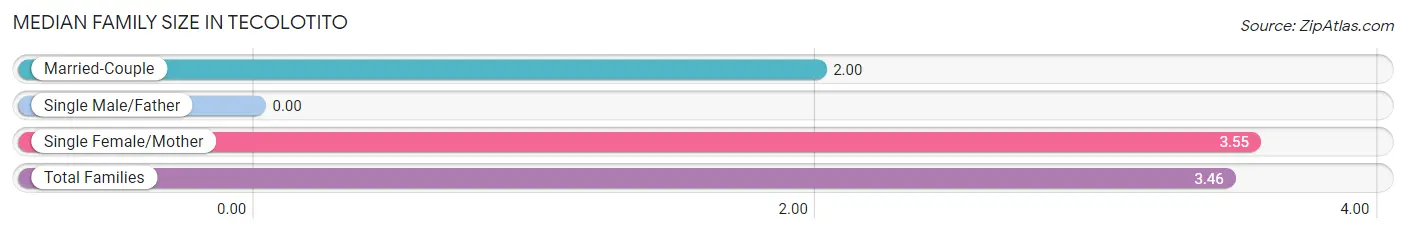
| Family Type | # Families | Family Size |
| Married-Couple | 7 (6.2%) | 2.00 |
| Single Male/Father | 0 (0.0%) | - |
| Single Female/Mother | 105 (93.8%) | 3.55 |
| Total Families | 112 (100.0%) | 3.46 |
Median Household Size in Tecolotito
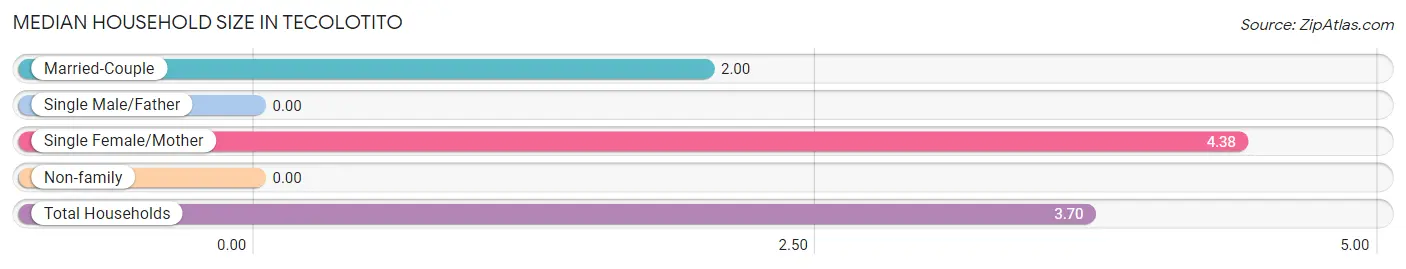
| Household Type | # Households | Household Size |
| Married-Couple | 7 (5.2%) | 2.00 |
| Single Male/Father | 0 (0.0%) | - |
| Single Female/Mother | 105 (78.4%) | 4.38 |
| Non-family | 22 (16.4%) | - |
| Total Households | 134 (100.0%) | 3.70 |
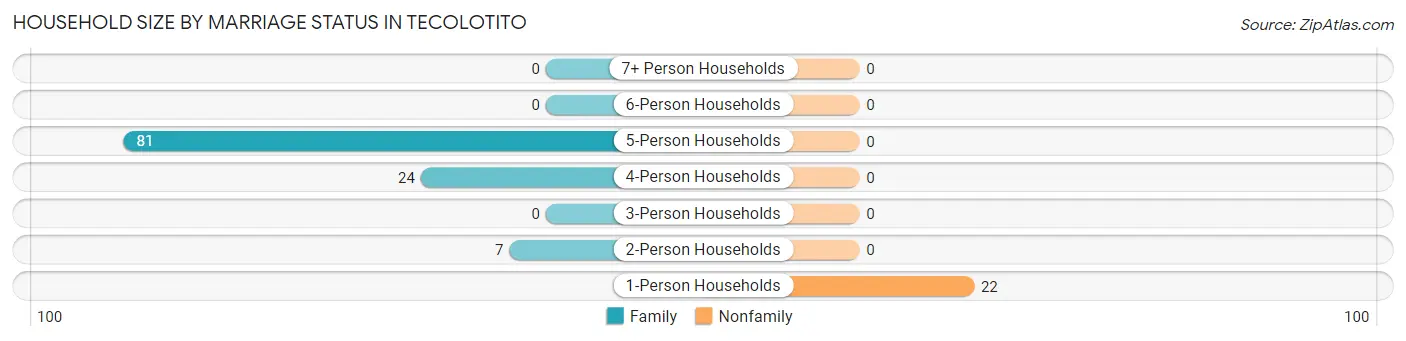
Household Size by Marriage Status in Tecolotito
Out of a total of 134 households in Tecolotito, 112 (83.6%) are family households, while 22 (16.4%) are nonfamily households. The most numerous type of family households are 5-person households, comprising 81, and the most common type of nonfamily households are 1-person households, comprising 22.
| Household Size | Family Households | Nonfamily Households |
| 1-Person Households | - | 22 (16.4%) |
| 2-Person Households | 7 (5.2%) | 0 (0.0%) |
| 3-Person Households | 0 (0.0%) | 0 (0.0%) |
| 4-Person Households | 24 (17.9%) | 0 (0.0%) |
| 5-Person Households | 81 (60.5%) | 0 (0.0%) |
| 6-Person Households | 0 (0.0%) | 0 (0.0%) |
| 7+ Person Households | 0 (0.0%) | 0 (0.0%) |
| Total | 112 (83.6%) | 22 (16.4%) |
Female Fertility in Tecolotito
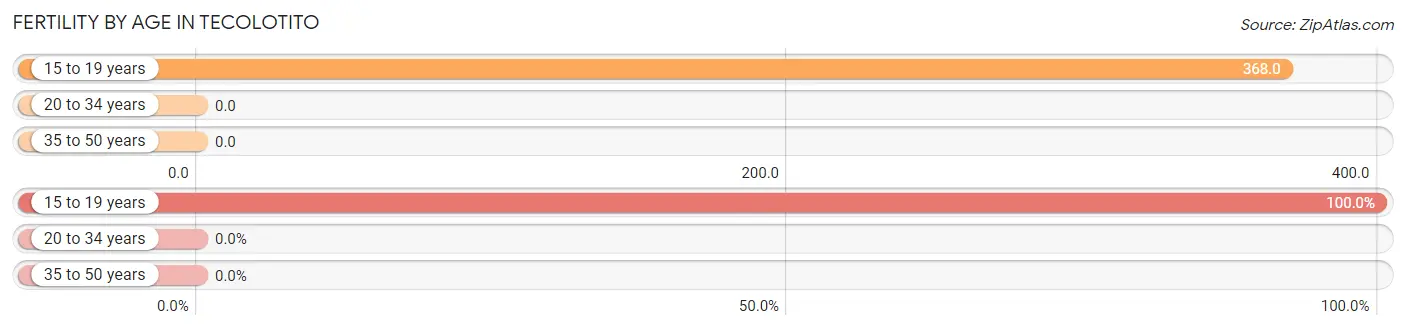
Fertility by Age in Tecolotito
Average fertility rate in Tecolotito is 150.0 births per 1,000 women. Women in the age bracket of 15 to 19 years have the highest fertility rate with 368.0 births per 1,000 women. Women in the age bracket of 15 to 19 years acount for 100.0% of all women with births.
| Age Bracket | Women with Births | Births / 1,000 Women |
| 15 to 19 years | 28 (100.0%) | 368.0 |
| 20 to 34 years | 0 (0.0%) | 0.0 |
| 35 to 50 years | 0 (0.0%) | 0.0 |
| Total | 28 (100.0%) | 150.0 |
Fertility by Age by Marriage Status in Tecolotito
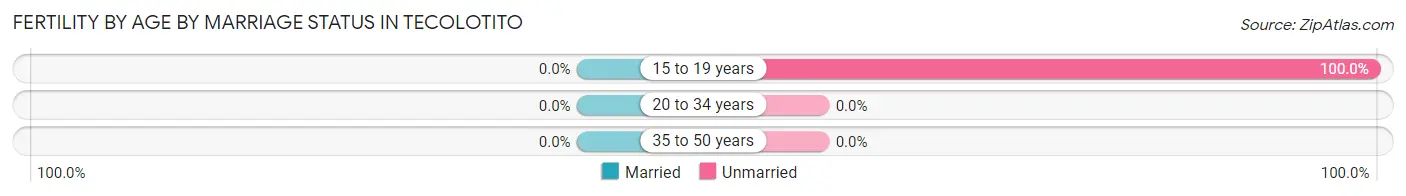
| Age Bracket | Married | Unmarried |
| 15 to 19 years | 0 (0.0%) | 28 (100.0%) |
| 20 to 34 years | 0 (0.0%) | 0 (0.0%) |
| 35 to 50 years | 0 (0.0%) | 0 (0.0%) |
| Total | 0 (0.0%) | 28 (100.0%) |
Fertility by Education in Tecolotito
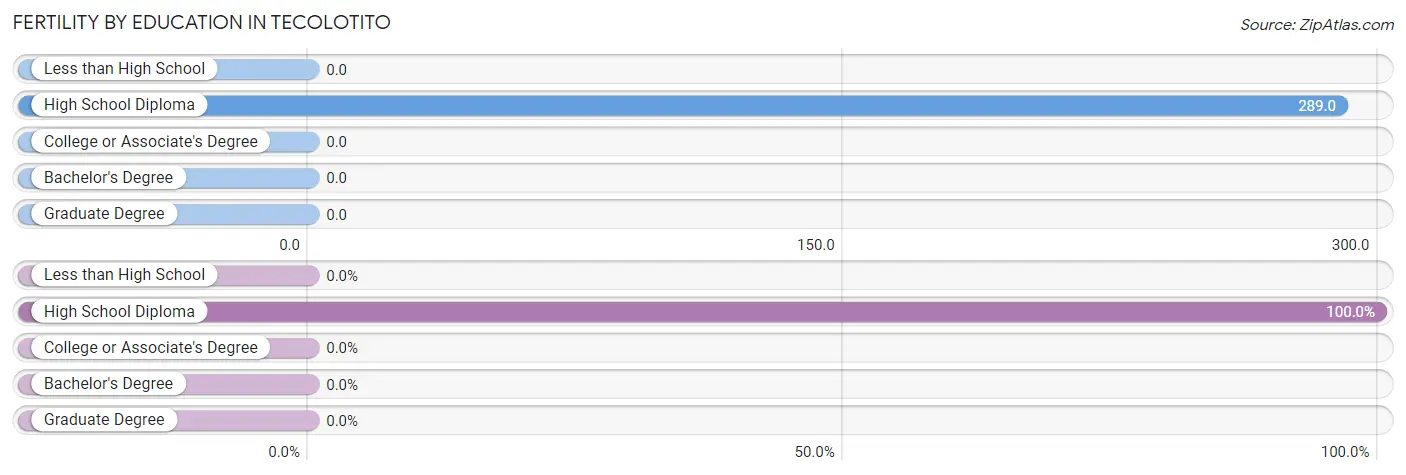
| Educational Attainment | Women with Births | Births / 1,000 Women |
| Less than High School | 0 (0.0%) | 0.0 |
| High School Diploma | 28 (100.0%) | 289.0 |
| College or Associate's Degree | 0 (0.0%) | 0.0 |
| Bachelor's Degree | 0 (0.0%) | 0.0 |
| Graduate Degree | 0 (0.0%) | 0.0 |
| Total | 28 (100.0%) | 150.0 |
Fertility by Education by Marriage Status in Tecolotito
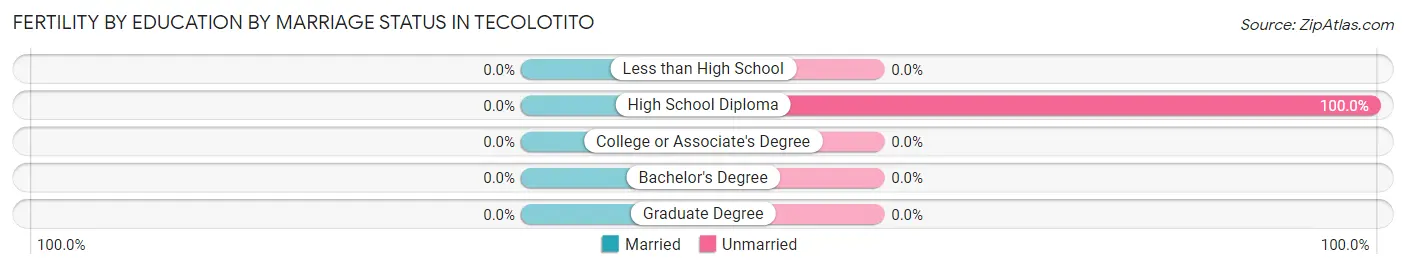
| Educational Attainment | Married | Unmarried |
| Less than High School | 0 (0.0%) | 0 (0.0%) |
| High School Diploma | 0 (0.0%) | 28 (100.0%) |
| College or Associate's Degree | 0 (0.0%) | 0 (0.0%) |
| Bachelor's Degree | 0 (0.0%) | 0 (0.0%) |
| Graduate Degree | 0 (0.0%) | 0 (0.0%) |
| Total | 0 (0.0%) | 28 (100.0%) |
Income in Tecolotito
Income Overview in Tecolotito
| Characteristic | Number | Measure |
| Per Capita Income | 496 | $9,009 |
| Median Family Income | 112 | $0 |
| Mean Family Income | 112 | $21,268 |
| Median Household Income | 134 | $33,971 |
| Mean Household Income | 134 | $33,035 |
| Income Deficit | 112 | $0 |
| Wage / Income Gap (%) | 496 | 0.00% |
| Wage / Income Gap ($) | 496 | 100.00¢ per $1 |
| Gini / Inequality Index | 496 | 0.29 |
Earnings by Sex in Tecolotito
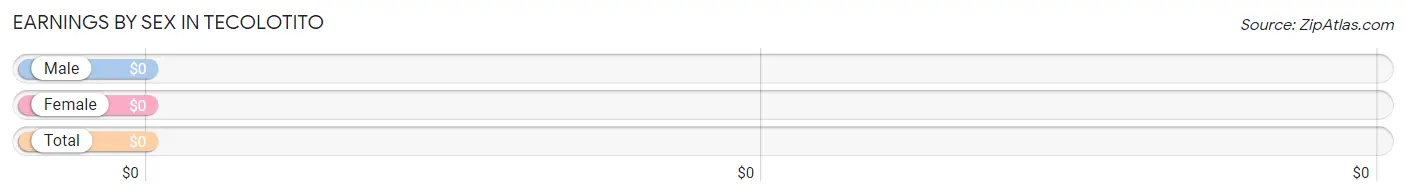
| Sex | Number | Average Earnings |
| Male | 0 (0.0%) | $0 |
| Female | 173 (100.0%) | $0 |
| Total | 173 (100.0%) | $0 |
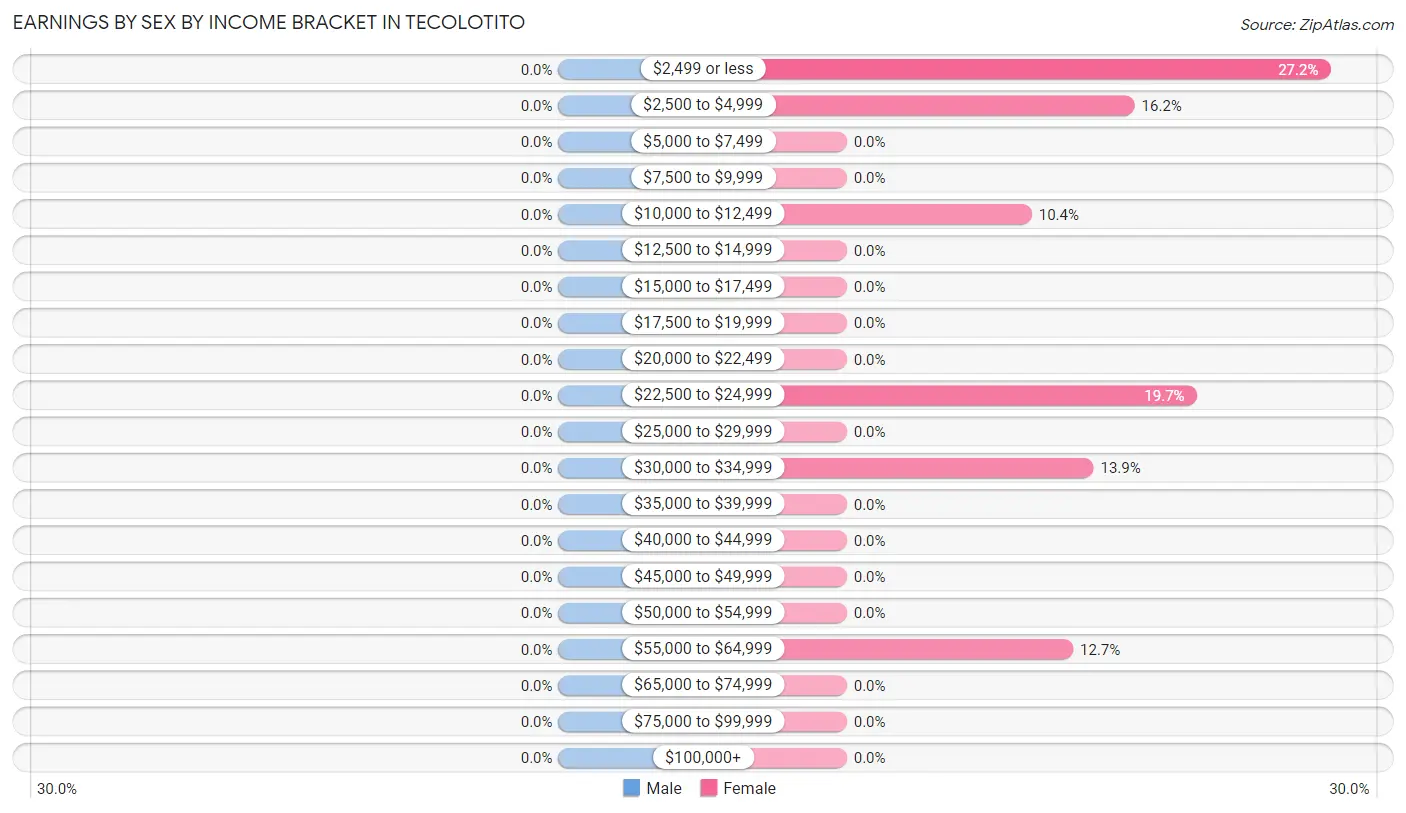
Earnings by Sex by Income Bracket in Tecolotito
| Income | Male | Female |
| $2,499 or less | 0 (0.0%) | 47 (27.2%) |
| $2,500 to $4,999 | 0 (0.0%) | 28 (16.2%) |
| $5,000 to $7,499 | 0 (0.0%) | 0 (0.0%) |
| $7,500 to $9,999 | 0 (0.0%) | 0 (0.0%) |
| $10,000 to $12,499 | 0 (0.0%) | 18 (10.4%) |
| $12,500 to $14,999 | 0 (0.0%) | 0 (0.0%) |
| $15,000 to $17,499 | 0 (0.0%) | 0 (0.0%) |
| $17,500 to $19,999 | 0 (0.0%) | 0 (0.0%) |
| $20,000 to $22,499 | 0 (0.0%) | 0 (0.0%) |
| $22,500 to $24,999 | 0 (0.0%) | 34 (19.7%) |
| $25,000 to $29,999 | 0 (0.0%) | 0 (0.0%) |
| $30,000 to $34,999 | 0 (0.0%) | 24 (13.9%) |
| $35,000 to $39,999 | 0 (0.0%) | 0 (0.0%) |
| $40,000 to $44,999 | 0 (0.0%) | 0 (0.0%) |
| $45,000 to $49,999 | 0 (0.0%) | 0 (0.0%) |
| $50,000 to $54,999 | 0 (0.0%) | 0 (0.0%) |
| $55,000 to $64,999 | 0 (0.0%) | 22 (12.7%) |
| $65,000 to $74,999 | 0 (0.0%) | 0 (0.0%) |
| $75,000 to $99,999 | 0 (0.0%) | 0 (0.0%) |
| $100,000+ | 0 (0.0%) | 0 (0.0%) |
| Total | 0 (0.0%) | 173 (100.0%) |
Earnings by Sex by Educational Attainment in Tecolotito
| Educational Attainment | Male Income | Female Income |
| Less than High School | - | - |
| High School Diploma | - | - |
| College or Associate's Degree | - | - |
| Bachelor's Degree | - | - |
| Graduate Degree | - | - |
| Total | - | - |
Family Income in Tecolotito
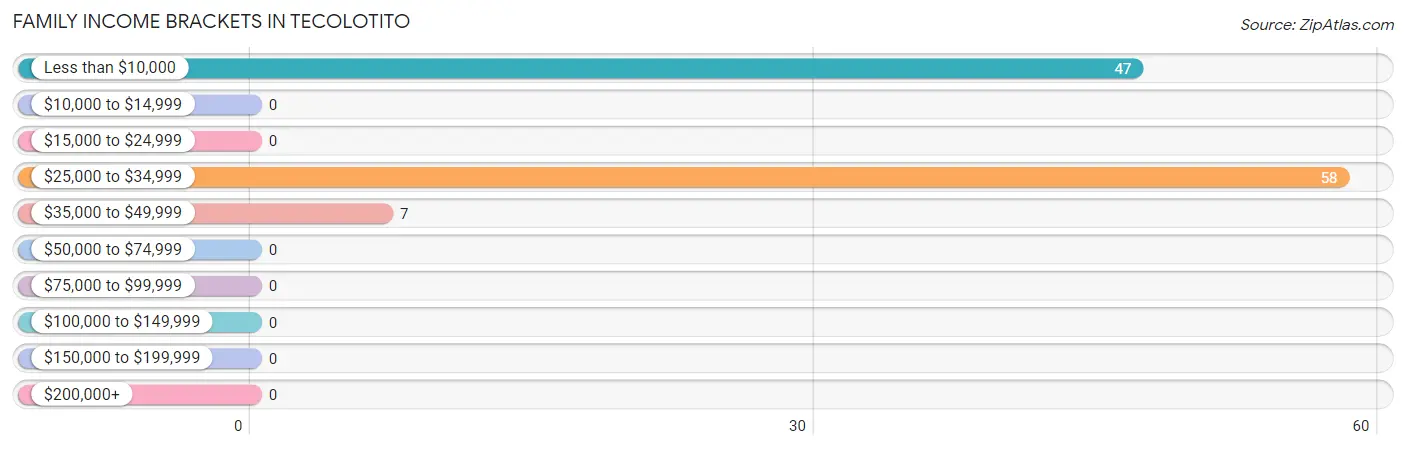
Family Income Brackets in Tecolotito
According to the Tecolotito family income data, there are 58 families falling into the $25,000 to $34,999 income range, which is the most common income bracket and makes up 51.8% of all families.
| Income Bracket | # Families | % Families |
| Less than $10,000 | 47 | 42.0% |
| $10,000 to $14,999 | 0 | 0.0% |
| $15,000 to $24,999 | 0 | 0.0% |
| $25,000 to $34,999 | 58 | 51.8% |
| $35,000 to $49,999 | 7 | 6.3% |
| $50,000 to $74,999 | 0 | 0.0% |
| $75,000 to $99,999 | 0 | 0.0% |
| $100,000 to $149,999 | 0 | 0.0% |
| $150,000 to $199,999 | 0 | 0.0% |
| $200,000+ | 0 | 0.0% |
Family Income by Famaliy Size in Tecolotito
| Income Bracket | # Families | Median Income |
| 2-Person Families | 7 (6.2%) | $0 |
| 3-Person Families | 24 (21.4%) | $0 |
| 4-Person Families | 47 (42.0%) | $0 |
| 5-Person Families | 34 (30.4%) | $0 |
| 6-Person Families | 0 (0.0%) | $0 |
| 7+ Person Families | 0 (0.0%) | $0 |
| Total | 112 (100.0%) | $0 |
Family Income by Number of Earners in Tecolotito
| Number of Earners | # Families | Median Income |
| No Earners | 7 (6.2%) | $0 |
| 1 Earner | 71 (63.4%) | $0 |
| 2 Earners | 34 (30.4%) | $0 |
| 3+ Earners | 0 (0.0%) | $0 |
| Total | 112 (100.0%) | $0 |
Household Income in Tecolotito
Household Income Brackets in Tecolotito
With 47 households falling in the category, the $10,000 to $14,999 income range is the most frequent in Tecolotito, accounting for 35.1% of all households.
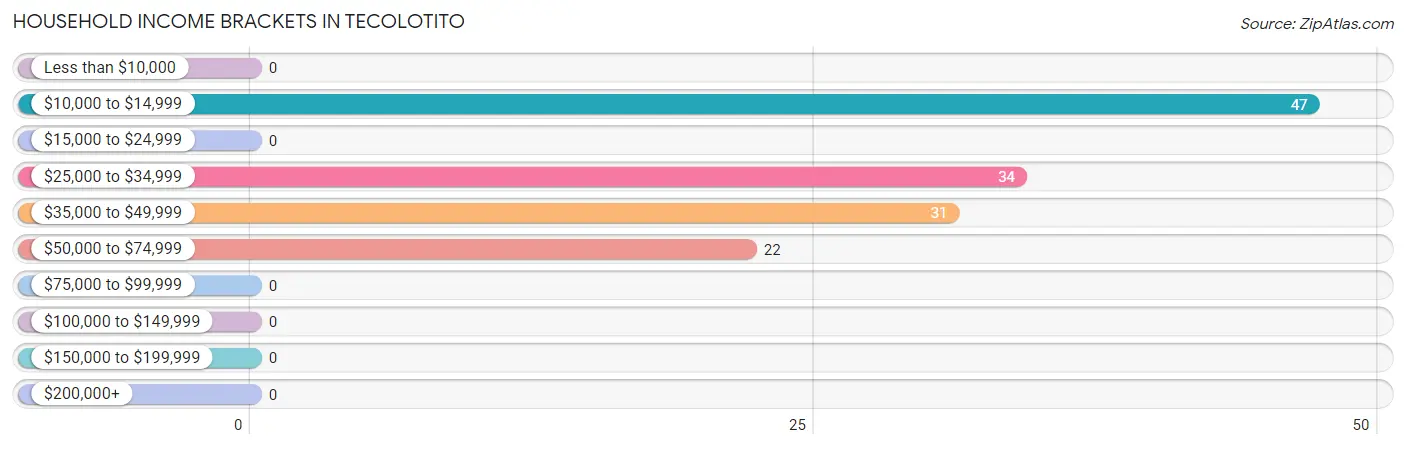
| Income Bracket | # Households | % Households |
| Less than $10,000 | 0 | 0.0% |
| $10,000 to $14,999 | 47 | 35.1% |
| $15,000 to $24,999 | 0 | 0.0% |
| $25,000 to $34,999 | 34 | 25.4% |
| $35,000 to $49,999 | 31 | 23.1% |
| $50,000 to $74,999 | 22 | 16.4% |
| $75,000 to $99,999 | 0 | 0.0% |
| $100,000 to $149,999 | 0 | 0.0% |
| $150,000 to $199,999 | 0 | 0.0% |
| $200,000+ | 0 | 0.0% |
Household Income by Householder Age in Tecolotito
| Income Bracket | # Households | Median Income |
| 15 to 24 Years | 0 (0.0%) | $0 |
| 25 to 44 Years | 93 (69.4%) | $0 |
| 45 to 64 Years | 34 (25.4%) | $0 |
| 65+ Years | 7 (5.2%) | $0 |
| Total | 134 (100.0%) | $33,971 |
Poverty in Tecolotito
Income Below Poverty by Sex and Age in Tecolotito
With 94.7% poverty level for males and 74.3% for females among the residents of Tecolotito, under 5 year old males and 16 and 17 year old females are the most vulnerable to poverty, with 32 males (100.0%) and 48 females (100.0%) in their respective age groups living below the poverty level.
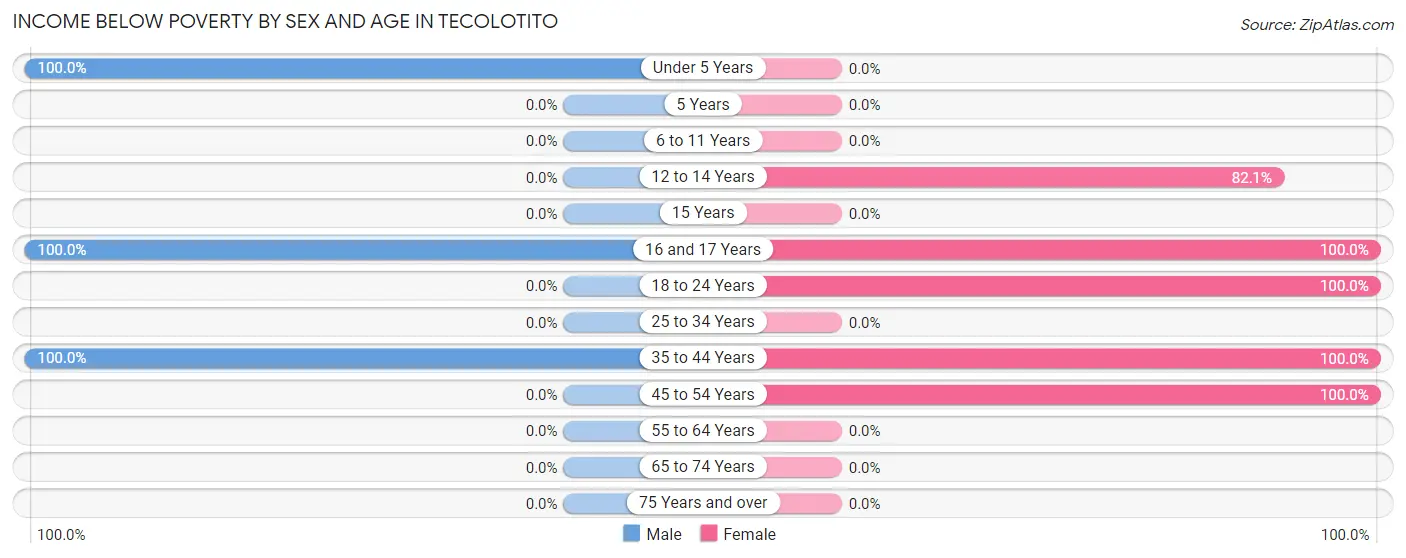
| Age Bracket | Male | Female |
| Under 5 Years | 32 (100.0%) | 0 (0.0%) |
| 5 Years | 0 (0.0%) | 0 (0.0%) |
| 6 to 11 Years | 0 (0.0%) | 0 (0.0%) |
| 12 to 14 Years | 0 (0.0%) | 96 (82.1%) |
| 15 Years | 0 (0.0%) | 0 (0.0%) |
| 16 and 17 Years | 23 (100.0%) | 48 (100.0%) |
| 18 to 24 Years | 0 (0.0%) | 46 (100.0%) |
| 25 to 34 Years | 0 (0.0%) | 0 (0.0%) |
| 35 to 44 Years | 69 (100.0%) | 47 (100.0%) |
| 45 to 54 Years | 0 (0.0%) | 34 (100.0%) |
| 55 to 64 Years | 0 (0.0%) | 0 (0.0%) |
| 65 to 74 Years | 0 (0.0%) | 0 (0.0%) |
| 75 Years and over | 0 (0.0%) | 0 (0.0%) |
| Total | 124 (94.7%) | 271 (74.3%) |
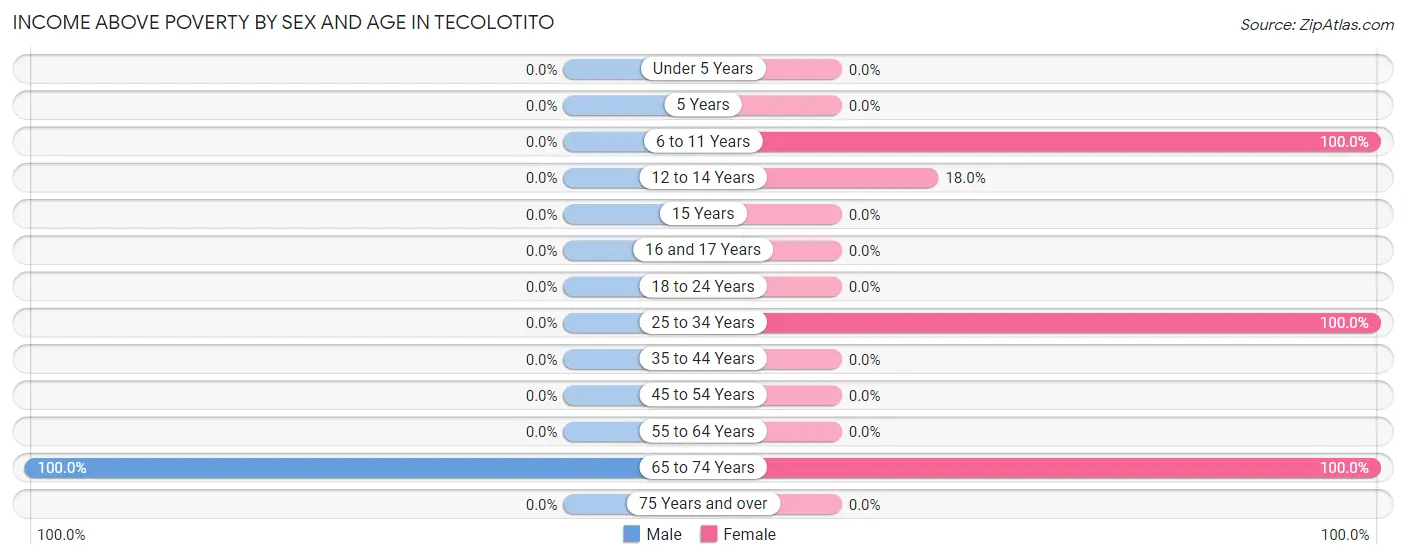
Income Above Poverty by Sex and Age in Tecolotito
According to the poverty statistics in Tecolotito, males aged 65 to 74 years and females aged 6 to 11 years are the age groups that are most secure financially, with 100.0% of males and 100.0% of females in these age groups living above the poverty line.
| Age Bracket | Male | Female |
| Under 5 Years | 0 (0.0%) | 0 (0.0%) |
| 5 Years | 0 (0.0%) | 0 (0.0%) |
| 6 to 11 Years | 0 (0.0%) | 20 (100.0%) |
| 12 to 14 Years | 0 (0.0%) | 21 (17.9%) |
| 15 Years | 0 (0.0%) | 0 (0.0%) |
| 16 and 17 Years | 0 (0.0%) | 0 (0.0%) |
| 18 to 24 Years | 0 (0.0%) | 0 (0.0%) |
| 25 to 34 Years | 0 (0.0%) | 46 (100.0%) |
| 35 to 44 Years | 0 (0.0%) | 0 (0.0%) |
| 45 to 54 Years | 0 (0.0%) | 0 (0.0%) |
| 55 to 64 Years | 0 (0.0%) | 0 (0.0%) |
| 65 to 74 Years | 7 (100.0%) | 7 (100.0%) |
| 75 Years and over | 0 (0.0%) | 0 (0.0%) |
| Total | 7 (5.3%) | 94 (25.8%) |
Income Below Poverty Among Married-Couple Families in Tecolotito
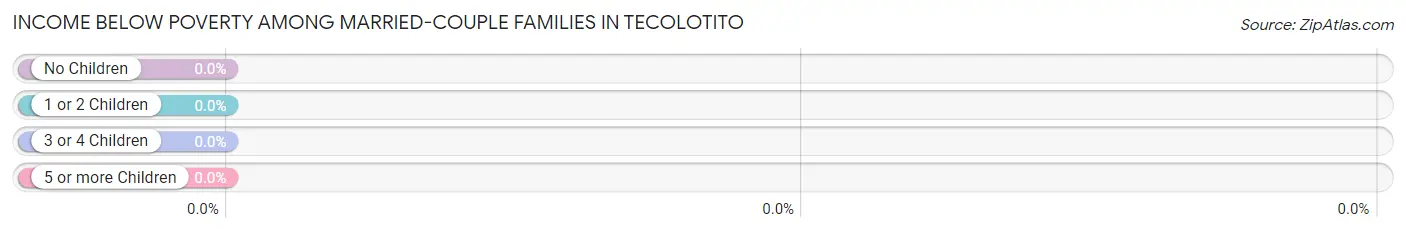
| Children | Above Poverty | Below Poverty |
| No Children | 7 (100.0%) | 0 (0.0%) |
| 1 or 2 Children | 0 (0.0%) | 0 (0.0%) |
| 3 or 4 Children | 0 (0.0%) | 0 (0.0%) |
| 5 or more Children | 0 (0.0%) | 0 (0.0%) |
| Total | 7 (100.0%) | 0 (0.0%) |
Income Below Poverty Among Single-Parent Households in Tecolotito
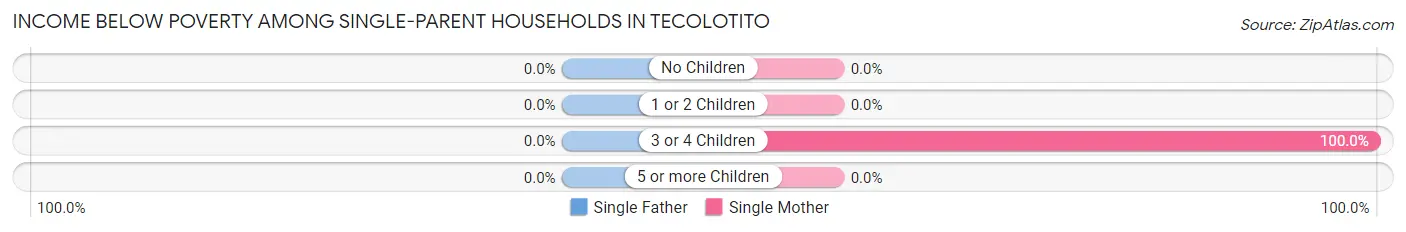
| Children | Single Father | Single Mother |
| No Children | 0 (0.0%) | 0 (0.0%) |
| 1 or 2 Children | 0 (0.0%) | 0 (0.0%) |
| 3 or 4 Children | 0 (0.0%) | 81 (100.0%) |
| 5 or more Children | 0 (0.0%) | 0 (0.0%) |
| Total | 0 (0.0%) | 81 (77.1%) |
Income Below Poverty Among Married-Couple vs Single-Parent Households in Tecolotito
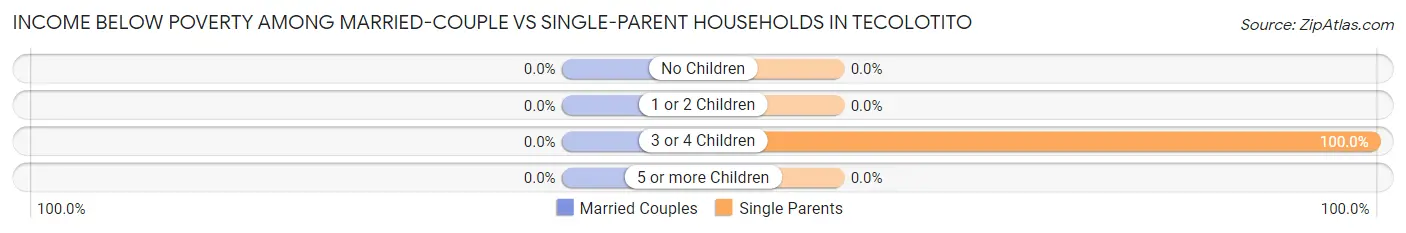
| Children | Married-Couple Families | Single-Parent Households |
| No Children | 0 (0.0%) | 0 (0.0%) |
| 1 or 2 Children | 0 (0.0%) | 0 (0.0%) |
| 3 or 4 Children | 0 (0.0%) | 81 (100.0%) |
| 5 or more Children | 0 (0.0%) | 0 (0.0%) |
| Total | 0 (0.0%) | 81 (77.1%) |
Employment Characteristics in Tecolotito
Employment by Class of Employer in Tecolotito
Among the 145 employed individuals in Tecolotito, state government employees (69 | 47.6%), private company employees (52 | 35.9%), and local government employees (24 | 16.6%) make up the most common classes of employment.
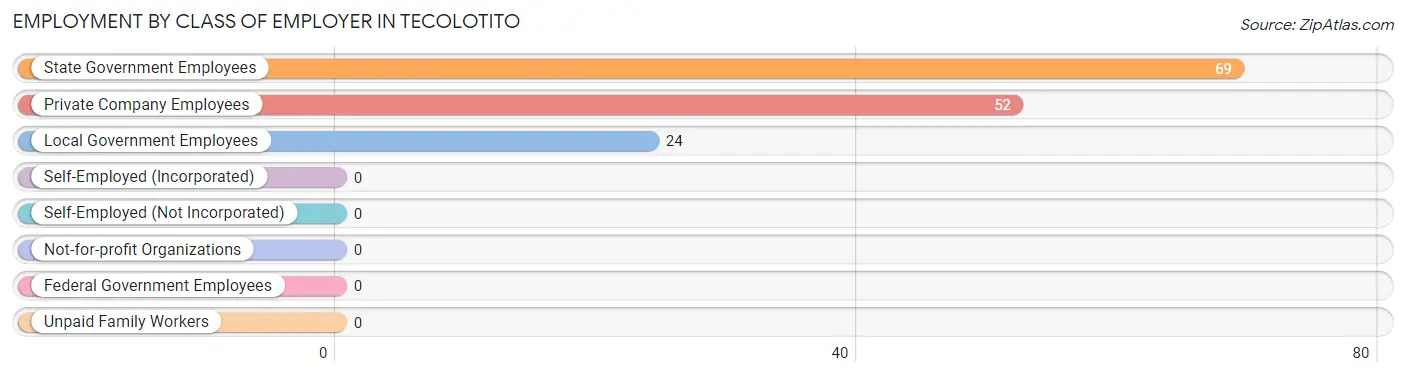
| Employer Class | # Employees | % Employees |
| Private Company Employees | 52 | 35.9% |
| Self-Employed (Incorporated) | 0 | 0.0% |
| Self-Employed (Not Incorporated) | 0 | 0.0% |
| Not-for-profit Organizations | 0 | 0.0% |
| Local Government Employees | 24 | 16.6% |
| State Government Employees | 69 | 47.6% |
| Federal Government Employees | 0 | 0.0% |
| Unpaid Family Workers | 0 | 0.0% |
| Total | 145 | 100.0% |
Employment Status by Age in Tecolotito
According to the labor force statistics for Tecolotito, out of the total population over 16 years of age (327), 52.9% or 173 individuals are in the labor force, with 16.2% or 28 of them unemployed. The age group with the highest labor force participation rate is 20 to 24 years, with 100.0% or 18 individuals in the labor force. Within the labor force, the 16 to 19 years age range has the highest percentage of unemployed individuals, with 100.0% or 28 of them being unemployed.
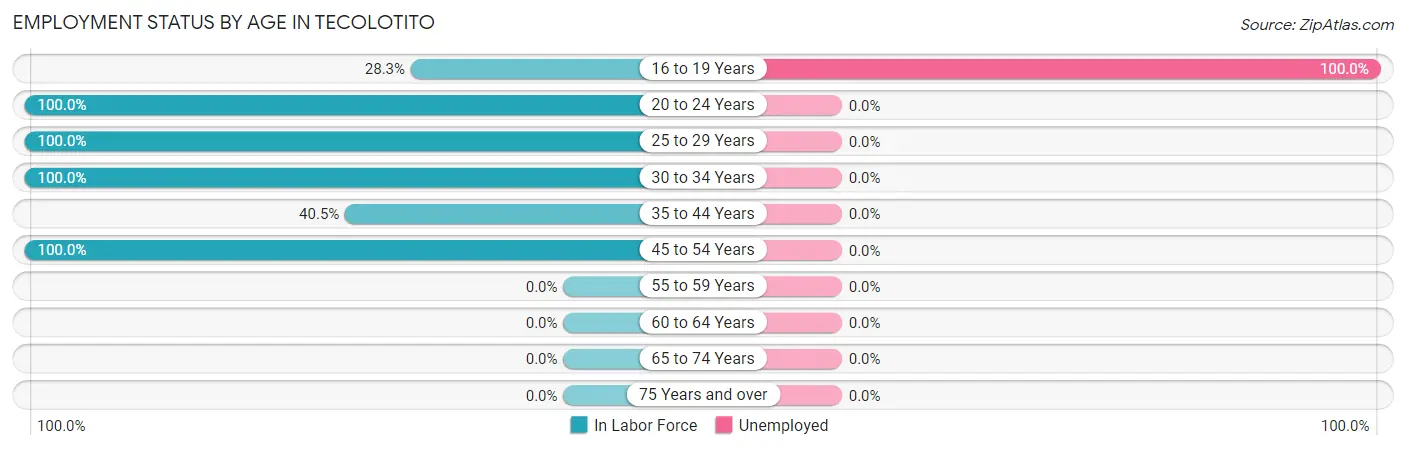
| Age Bracket | In Labor Force | Unemployed |
| 16 to 19 Years | 28 (28.3%) | 28 (100.0%) |
| 20 to 24 Years | 18 (100.0%) | 0 (0.0%) |
| 25 to 29 Years | 22 (100.0%) | 0 (0.0%) |
| 30 to 34 Years | 24 (100.0%) | 0 (0.0%) |
| 35 to 44 Years | 47 (40.5%) | 0 (0.0%) |
| 45 to 54 Years | 34 (100.0%) | 0 (0.0%) |
| 55 to 59 Years | 0 (0.0%) | 0 (0.0%) |
| 60 to 64 Years | 0 (0.0%) | 0 (0.0%) |
| 65 to 74 Years | 0 (0.0%) | 0 (0.0%) |
| 75 Years and over | 0 (0.0%) | 0 (0.0%) |
| Total | 173 (52.9%) | 28 (16.2%) |
Employment Status by Educational Attainment in Tecolotito
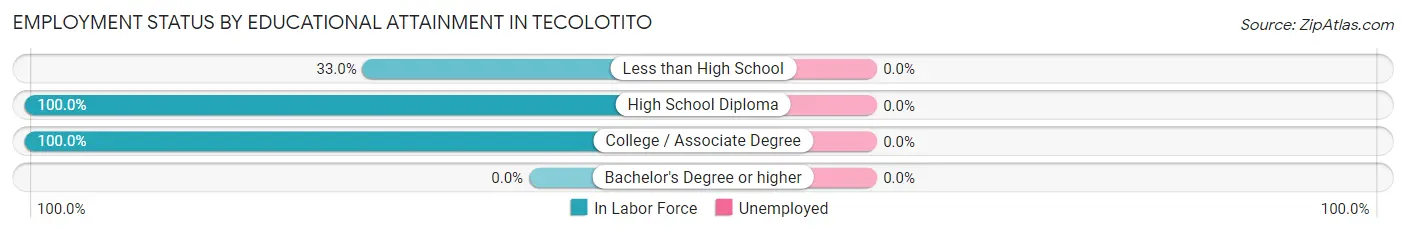
| Educational Attainment | In Labor Force | Unemployed |
| Less than High School | 34 (33.0%) | 0 (0.0%) |
| High School Diploma | 69 (100.0%) | 0 (0.0%) |
| College / Associate Degree | 24 (100.0%) | 0 (0.0%) |
| Bachelor's Degree or higher | 0 (0.0%) | 0 (0.0%) |
| Total | 127 (64.8%) | 0 (0.0%) |
Employment Occupations by Sex in Tecolotito
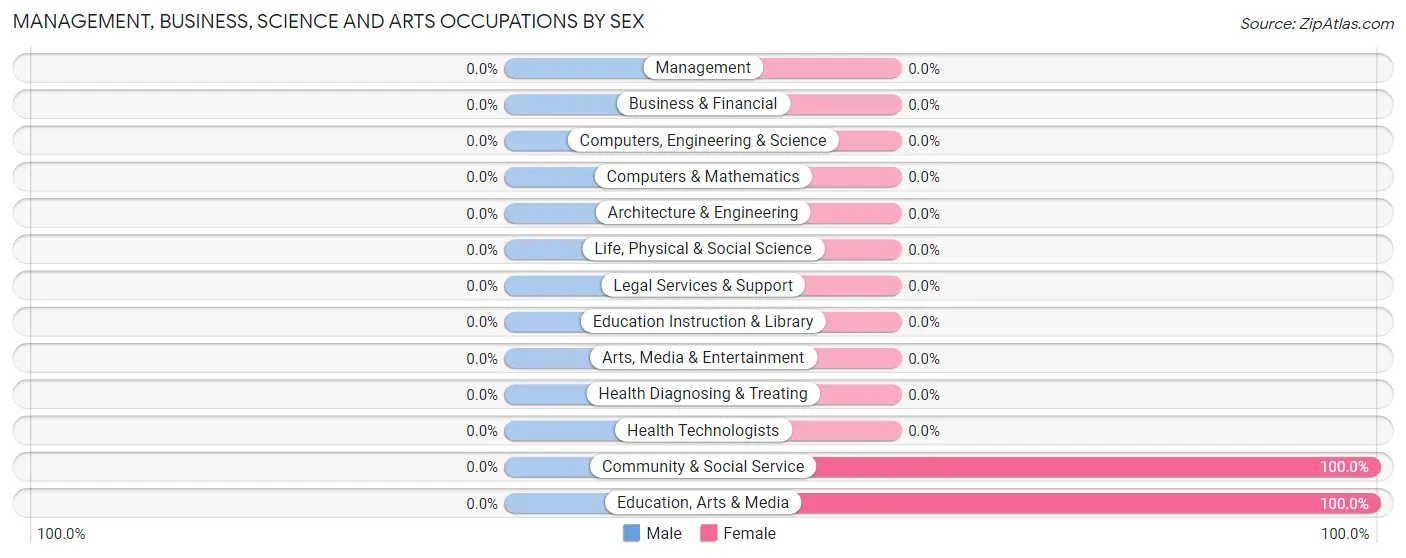
Management, Business, Science and Arts Occupations
The most common Management, Business, Science and Arts occupations in Tecolotito are Community & Social Service (24 | 16.6%), and Education, Arts & Media (24 | 16.6%).
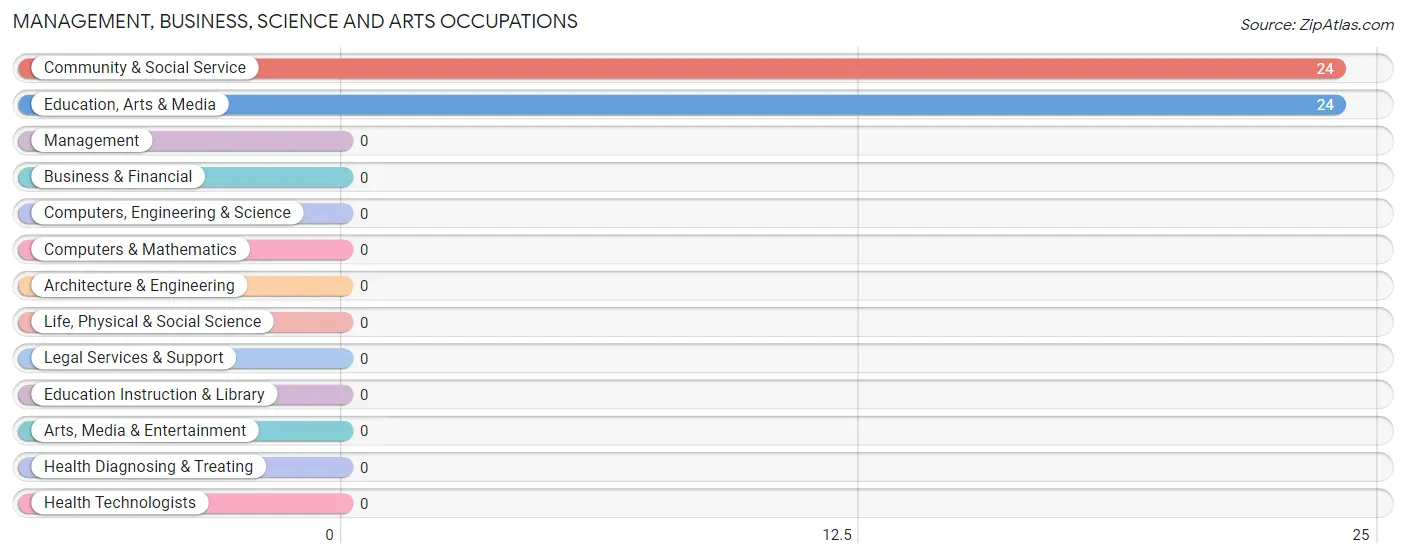
Management, Business, Science and Arts Occupations by Sex
| Occupation | Male | Female |
| Management | 0 (0.0%) | 0 (0.0%) |
| Business & Financial | 0 (0.0%) | 0 (0.0%) |
| Computers, Engineering & Science | 0 (0.0%) | 0 (0.0%) |
| Computers & Mathematics | 0 (0.0%) | 0 (0.0%) |
| Architecture & Engineering | 0 (0.0%) | 0 (0.0%) |
| Life, Physical & Social Science | 0 (0.0%) | 0 (0.0%) |
| Community & Social Service | 0 (0.0%) | 24 (100.0%) |
| Education, Arts & Media | 0 (0.0%) | 24 (100.0%) |
| Legal Services & Support | 0 (0.0%) | 0 (0.0%) |
| Education Instruction & Library | 0 (0.0%) | 0 (0.0%) |
| Arts, Media & Entertainment | 0 (0.0%) | 0 (0.0%) |
| Health Diagnosing & Treating | 0 (0.0%) | 0 (0.0%) |
| Health Technologists | 0 (0.0%) | 0 (0.0%) |
| Total (Category) | 0 (0.0%) | 24 (100.0%) |
| Total (Overall) | 0 (0.0%) | 145 (100.0%) |
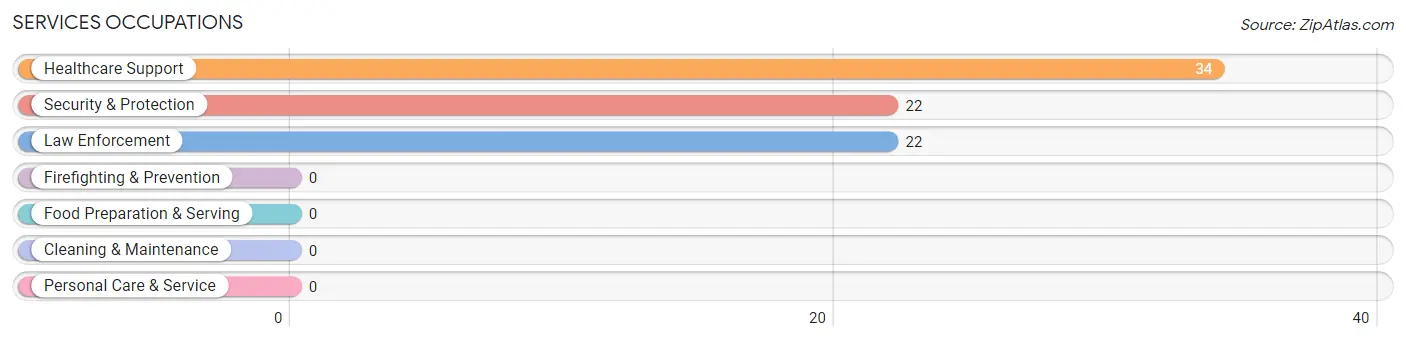
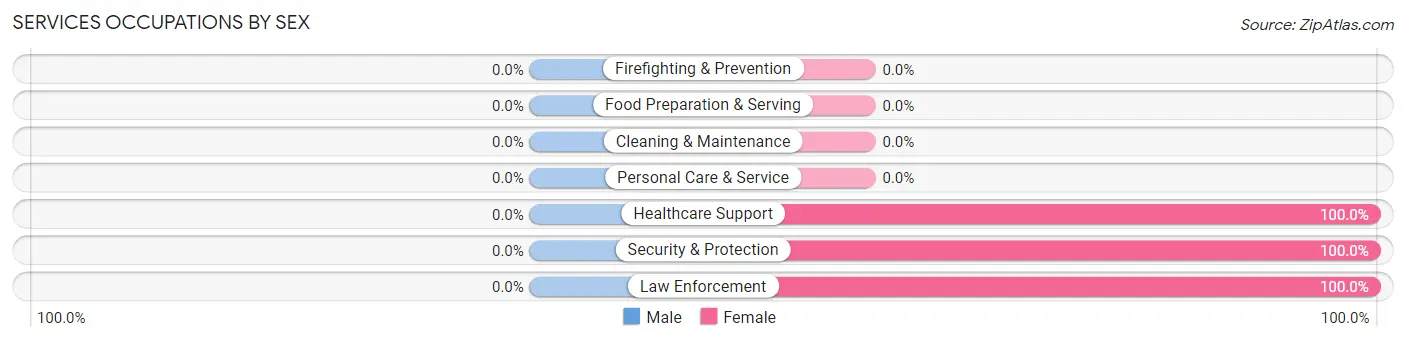
Services Occupations
The most common Services occupations in Tecolotito are Healthcare Support (34 | 23.4%), Security & Protection (22 | 15.2%), and Law Enforcement (22 | 15.2%).
Services Occupations by Sex
| Occupation | Male | Female |
| Healthcare Support | 0 (0.0%) | 34 (100.0%) |
| Security & Protection | 0 (0.0%) | 22 (100.0%) |
| Firefighting & Prevention | 0 (0.0%) | 0 (0.0%) |
| Law Enforcement | 0 (0.0%) | 22 (100.0%) |
| Food Preparation & Serving | 0 (0.0%) | 0 (0.0%) |
| Cleaning & Maintenance | 0 (0.0%) | 0 (0.0%) |
| Personal Care & Service | 0 (0.0%) | 0 (0.0%) |
| Total (Category) | 0 (0.0%) | 56 (100.0%) |
| Total (Overall) | 0 (0.0%) | 145 (100.0%) |
Sales and Office Occupations
The most common Sales and Office occupations in Tecolotito are , and Sales & Related (18 | 12.4%).
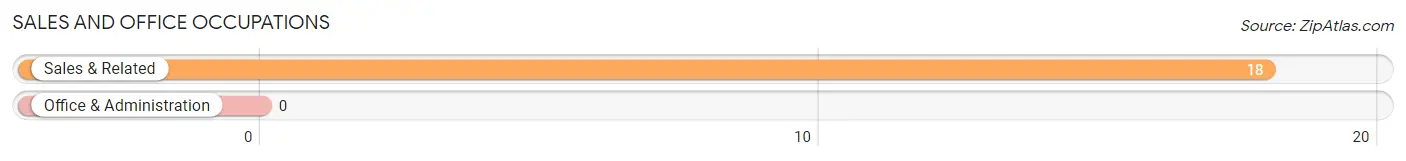
Sales and Office Occupations by Sex

| Occupation | Male | Female |
| Sales & Related | 0 (0.0%) | 18 (100.0%) |
| Office & Administration | 0 (0.0%) | 0 (0.0%) |
| Total (Category) | 0 (0.0%) | 18 (100.0%) |
| Total (Overall) | 0 (0.0%) | 145 (100.0%) |
Natural Resources, Construction and Maintenance Occupations
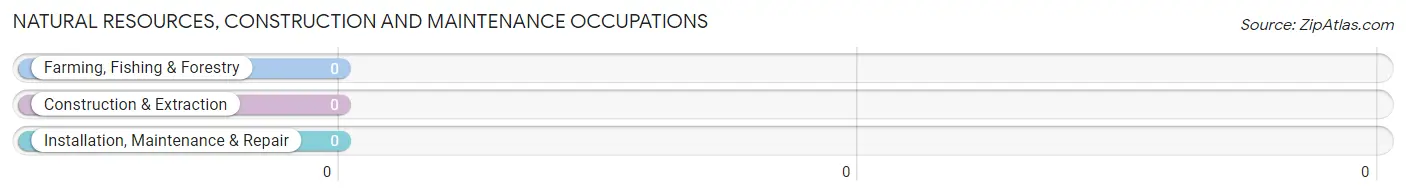
Natural Resources, Construction and Maintenance Occupations by Sex
| Occupation | Male | Female |
| Farming, Fishing & Forestry | 0 (0.0%) | 0 (0.0%) |
| Construction & Extraction | 0 (0.0%) | 0 (0.0%) |
| Installation, Maintenance & Repair | 0 (0.0%) | 0 (0.0%) |
| Total (Category) | 0 (0.0%) | 0 (0.0%) |
| Total (Overall) | 0 (0.0%) | 145 (100.0%) |
Production, Transportation and Moving Occupations
The most common Production, Transportation and Moving occupations in Tecolotito are , and Transportation (47 | 32.4%).
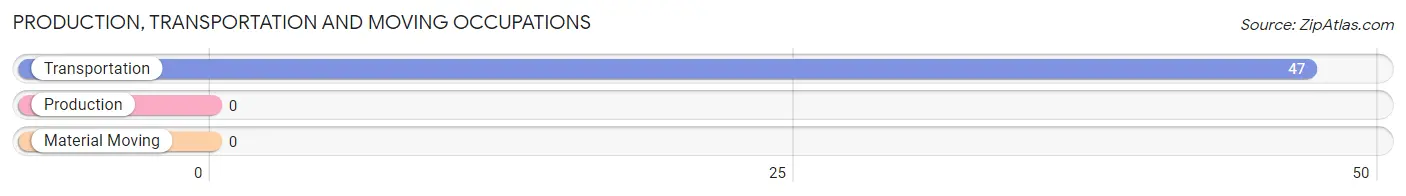
Production, Transportation and Moving Occupations by Sex
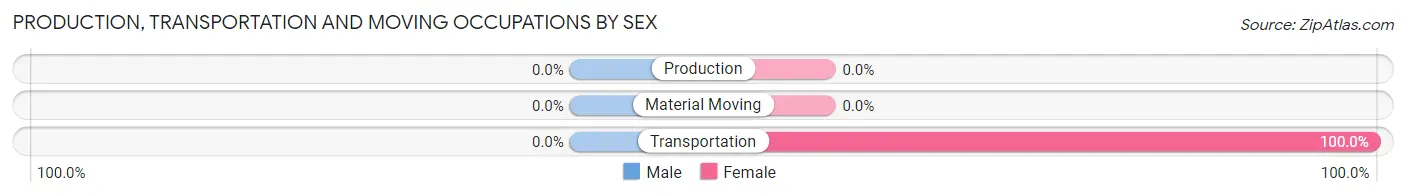
| Occupation | Male | Female |
| Production | 0 (0.0%) | 0 (0.0%) |
| Transportation | 0 (0.0%) | 47 (100.0%) |
| Material Moving | 0 (0.0%) | 0 (0.0%) |
| Total (Category) | 0 (0.0%) | 47 (100.0%) |
| Total (Overall) | 0 (0.0%) | 145 (100.0%) |
Employment Industries by Sex in Tecolotito
Employment Industries in Tecolotito
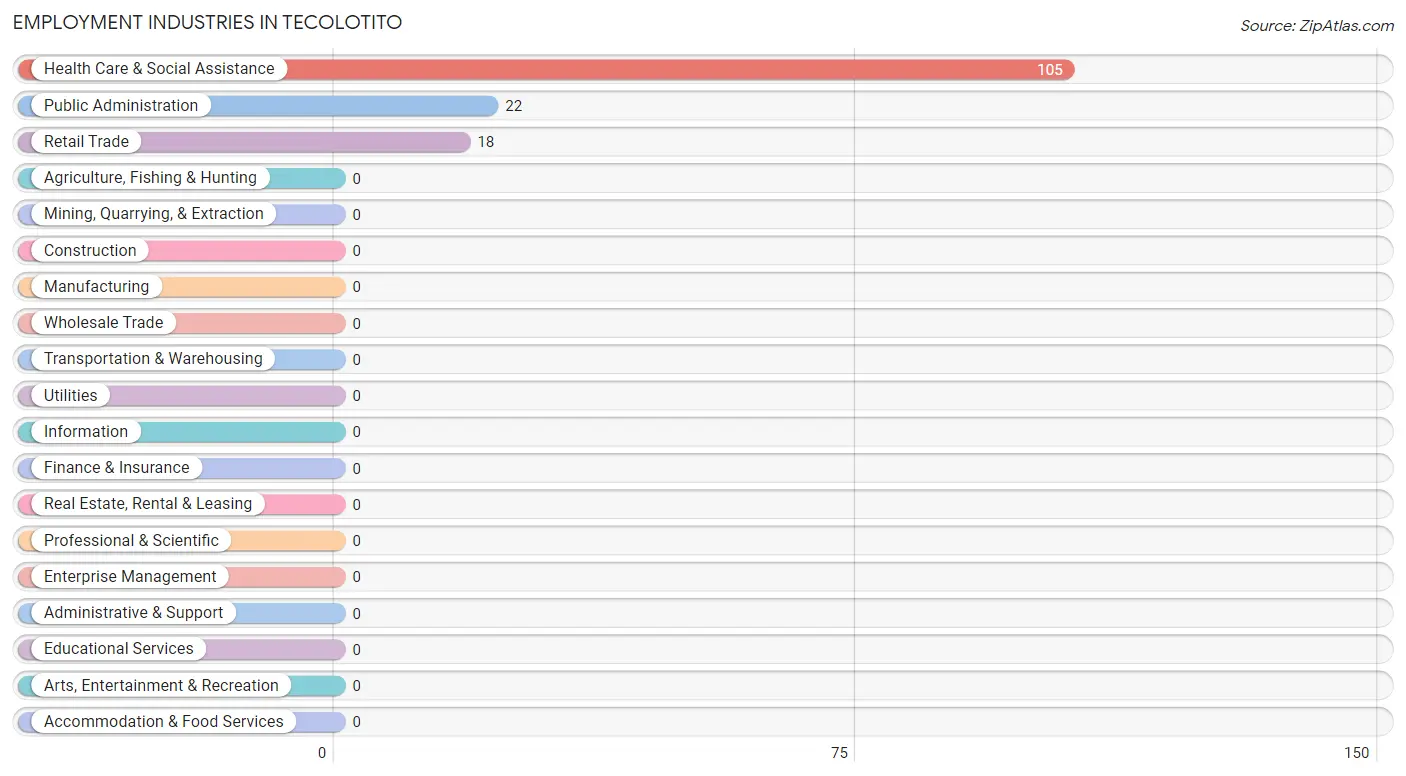
The major employment industries in Tecolotito include Health Care & Social Assistance (105 | 72.4%), Public Administration (22 | 15.2%), and Retail Trade (18 | 12.4%).
Employment Industries by Sex in Tecolotito
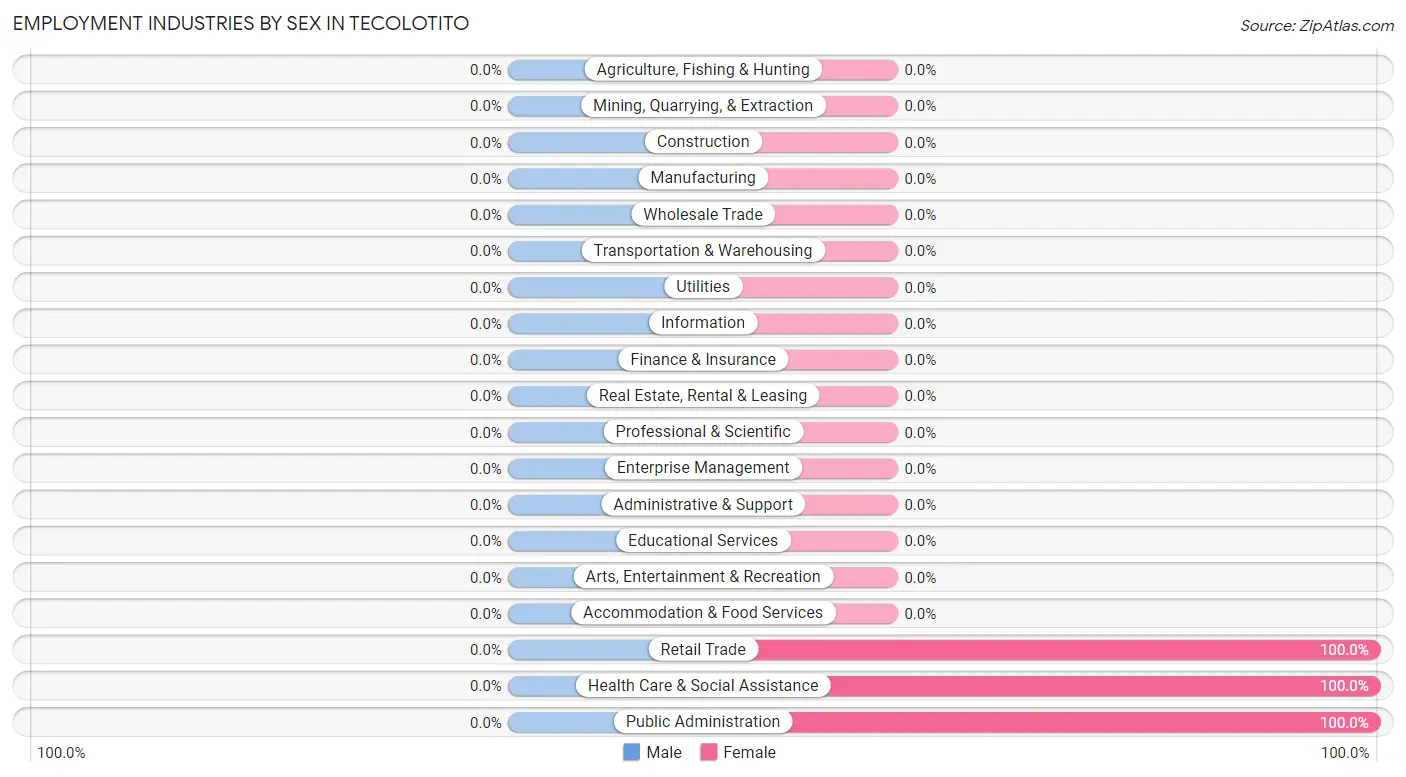
| Industry | Male | Female |
| Agriculture, Fishing & Hunting | 0 (0.0%) | 0 (0.0%) |
| Mining, Quarrying, & Extraction | 0 (0.0%) | 0 (0.0%) |
| Construction | 0 (0.0%) | 0 (0.0%) |
| Manufacturing | 0 (0.0%) | 0 (0.0%) |
| Wholesale Trade | 0 (0.0%) | 0 (0.0%) |
| Retail Trade | 0 (0.0%) | 18 (100.0%) |
| Transportation & Warehousing | 0 (0.0%) | 0 (0.0%) |
| Utilities | 0 (0.0%) | 0 (0.0%) |
| Information | 0 (0.0%) | 0 (0.0%) |
| Finance & Insurance | 0 (0.0%) | 0 (0.0%) |
| Real Estate, Rental & Leasing | 0 (0.0%) | 0 (0.0%) |
| Professional & Scientific | 0 (0.0%) | 0 (0.0%) |
| Enterprise Management | 0 (0.0%) | 0 (0.0%) |
| Administrative & Support | 0 (0.0%) | 0 (0.0%) |
| Educational Services | 0 (0.0%) | 0 (0.0%) |
| Health Care & Social Assistance | 0 (0.0%) | 105 (100.0%) |
| Arts, Entertainment & Recreation | 0 (0.0%) | 0 (0.0%) |
| Accommodation & Food Services | 0 (0.0%) | 0 (0.0%) |
| Public Administration | 0 (0.0%) | 22 (100.0%) |
| Total | 0 (0.0%) | 145 (100.0%) |
Education in Tecolotito
School Enrollment in Tecolotito
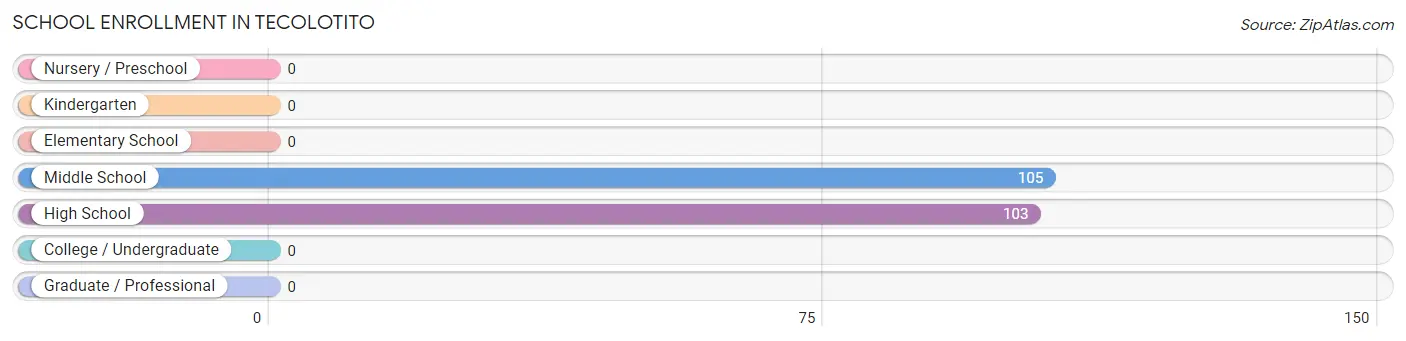
The most common levels of schooling among the 208 students in Tecolotito are middle school (105 | 50.5%), and high school (103 | 49.5%).
| School Level | # Students | % Students |
| Nursery / Preschool | 0 | 0.0% |
| Kindergarten | 0 | 0.0% |
| Elementary School | 0 | 0.0% |
| Middle School | 105 | 50.5% |
| High School | 103 | 49.5% |
| College / Undergraduate | 0 | 0.0% |
| Graduate / Professional | 0 | 0.0% |
| Total | 208 | 100.0% |
School Enrollment by Age by Funding Source in Tecolotito
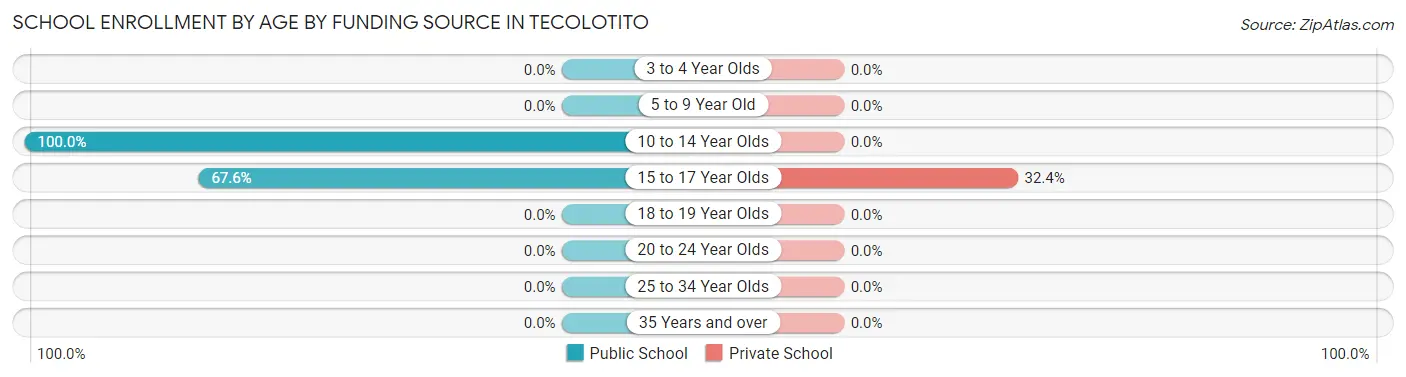
Out of a total of 208 students who are enrolled in schools in Tecolotito, 23 (11.1%) attend a private institution, while the remaining 185 (88.9%) are enrolled in public schools. The age group of 15 to 17 year olds has the highest likelihood of being enrolled in private schools, with 23 (32.4% in the age bracket) enrolled. Conversely, the age group of 10 to 14 year olds has the lowest likelihood of being enrolled in a private school, with 137 (100.0% in the age bracket) attending a public institution.
| Age Bracket | Public School | Private School |
| 3 to 4 Year Olds | 0 (0.0%) | 0 (0.0%) |
| 5 to 9 Year Old | 0 (0.0%) | 0 (0.0%) |
| 10 to 14 Year Olds | 137 (100.0%) | 0 (0.0%) |
| 15 to 17 Year Olds | 48 (67.6%) | 23 (32.4%) |
| 18 to 19 Year Olds | 0 (0.0%) | 0 (0.0%) |
| 20 to 24 Year Olds | 0 (0.0%) | 0 (0.0%) |
| 25 to 34 Year Olds | 0 (0.0%) | 0 (0.0%) |
| 35 Years and over | 0 (0.0%) | 0 (0.0%) |
| Total | 185 (88.9%) | 23 (11.1%) |
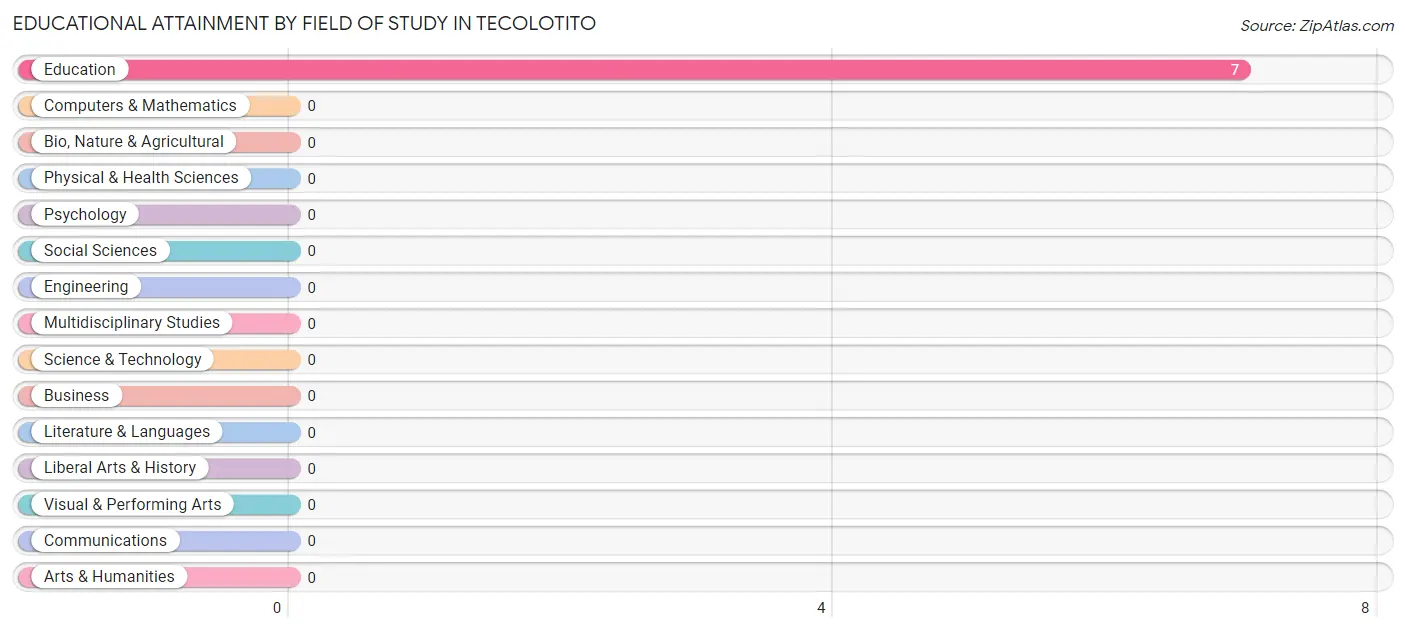
Educational Attainment by Field of Study in Tecolotito
, and education (7 | 100.0%) are the most common fields of study among 7 individuals in Tecolotito who have obtained a bachelor's degree or higher.
| Field of Study | # Graduates | % Graduates |
| Computers & Mathematics | 0 | 0.0% |
| Bio, Nature & Agricultural | 0 | 0.0% |
| Physical & Health Sciences | 0 | 0.0% |
| Psychology | 0 | 0.0% |
| Social Sciences | 0 | 0.0% |
| Engineering | 0 | 0.0% |
| Multidisciplinary Studies | 0 | 0.0% |
| Science & Technology | 0 | 0.0% |
| Business | 0 | 0.0% |
| Education | 7 | 100.0% |
| Literature & Languages | 0 | 0.0% |
| Liberal Arts & History | 0 | 0.0% |
| Visual & Performing Arts | 0 | 0.0% |
| Communications | 0 | 0.0% |
| Arts & Humanities | 0 | 0.0% |
| Total | 7 | 100.0% |
Transportation & Commute in Tecolotito
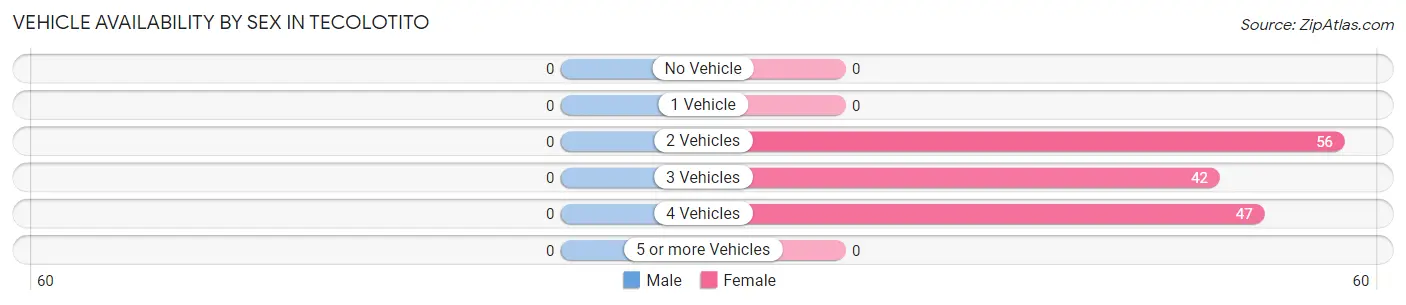
Vehicle Availability by Sex in Tecolotito
| Vehicles Available | Male | Female |
| No Vehicle | 0 (0.0%) | 0 (0.0%) |
| 1 Vehicle | 0 (0.0%) | 0 (0.0%) |
| 2 Vehicles | 0 (0.0%) | 56 (38.6%) |
| 3 Vehicles | 0 (0.0%) | 42 (29.0%) |
| 4 Vehicles | 0 (0.0%) | 47 (32.4%) |
| 5 or more Vehicles | 0 (0.0%) | 0 (0.0%) |
| Total | 0 (0.0%) | 145 (100.0%) |
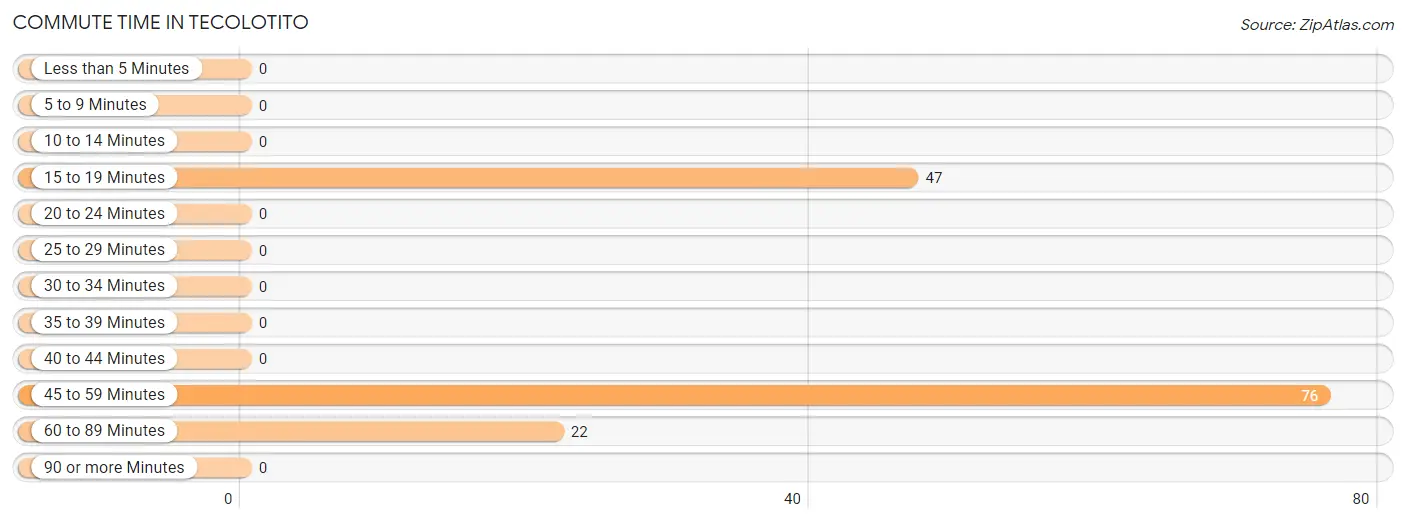
Commute Time in Tecolotito
The most frequently occuring commute durations in Tecolotito are 45 to 59 minutes (76 commuters, 52.4%), 15 to 19 minutes (47 commuters, 32.4%), and 60 to 89 minutes (22 commuters, 15.2%).
| Commute Time | # Commuters | % Commuters |
| Less than 5 Minutes | 0 | 0.0% |
| 5 to 9 Minutes | 0 | 0.0% |
| 10 to 14 Minutes | 0 | 0.0% |
| 15 to 19 Minutes | 47 | 32.4% |
| 20 to 24 Minutes | 0 | 0.0% |
| 25 to 29 Minutes | 0 | 0.0% |
| 30 to 34 Minutes | 0 | 0.0% |
| 35 to 39 Minutes | 0 | 0.0% |
| 40 to 44 Minutes | 0 | 0.0% |
| 45 to 59 Minutes | 76 | 52.4% |
| 60 to 89 Minutes | 22 | 15.2% |
| 90 or more Minutes | 0 | 0.0% |
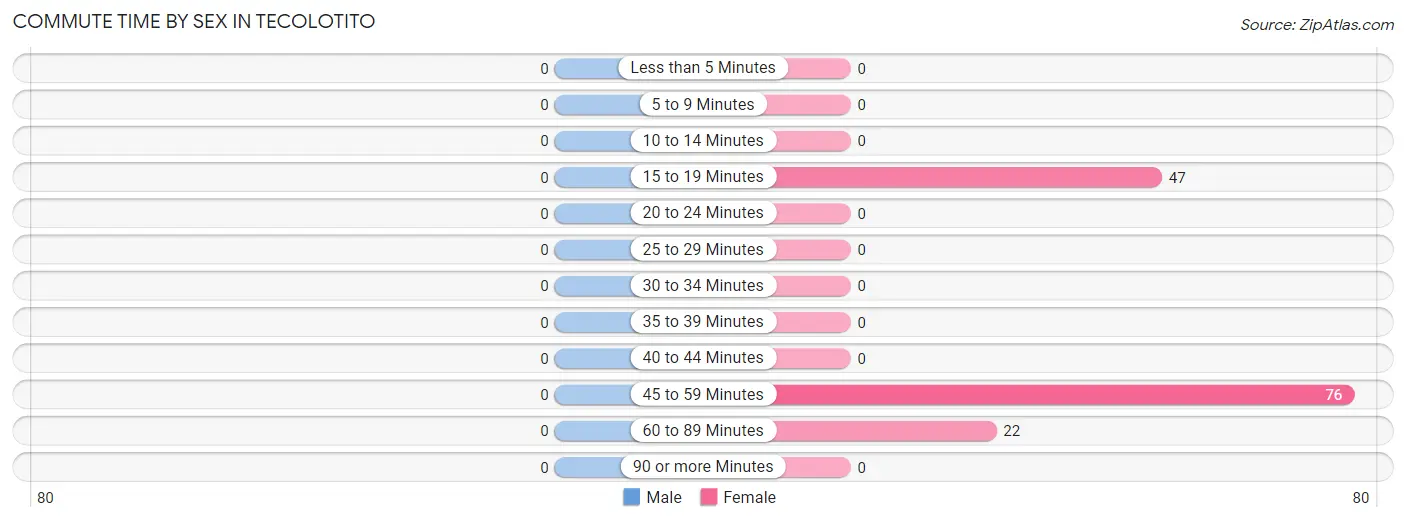
Commute Time by Sex in Tecolotito
| Commute Time | Male | Female |
| Less than 5 Minutes | 0 (0.0%) | 0 (0.0%) |
| 5 to 9 Minutes | 0 (0.0%) | 0 (0.0%) |
| 10 to 14 Minutes | 0 (0.0%) | 0 (0.0%) |
| 15 to 19 Minutes | 0 (0.0%) | 47 (32.4%) |
| 20 to 24 Minutes | 0 (0.0%) | 0 (0.0%) |
| 25 to 29 Minutes | 0 (0.0%) | 0 (0.0%) |
| 30 to 34 Minutes | 0 (0.0%) | 0 (0.0%) |
| 35 to 39 Minutes | 0 (0.0%) | 0 (0.0%) |
| 40 to 44 Minutes | 0 (0.0%) | 0 (0.0%) |
| 45 to 59 Minutes | 0 (0.0%) | 76 (52.4%) |
| 60 to 89 Minutes | 0 (0.0%) | 22 (15.2%) |
| 90 or more Minutes | 0 (0.0%) | 0 (0.0%) |
Time of Departure to Work by Sex in Tecolotito
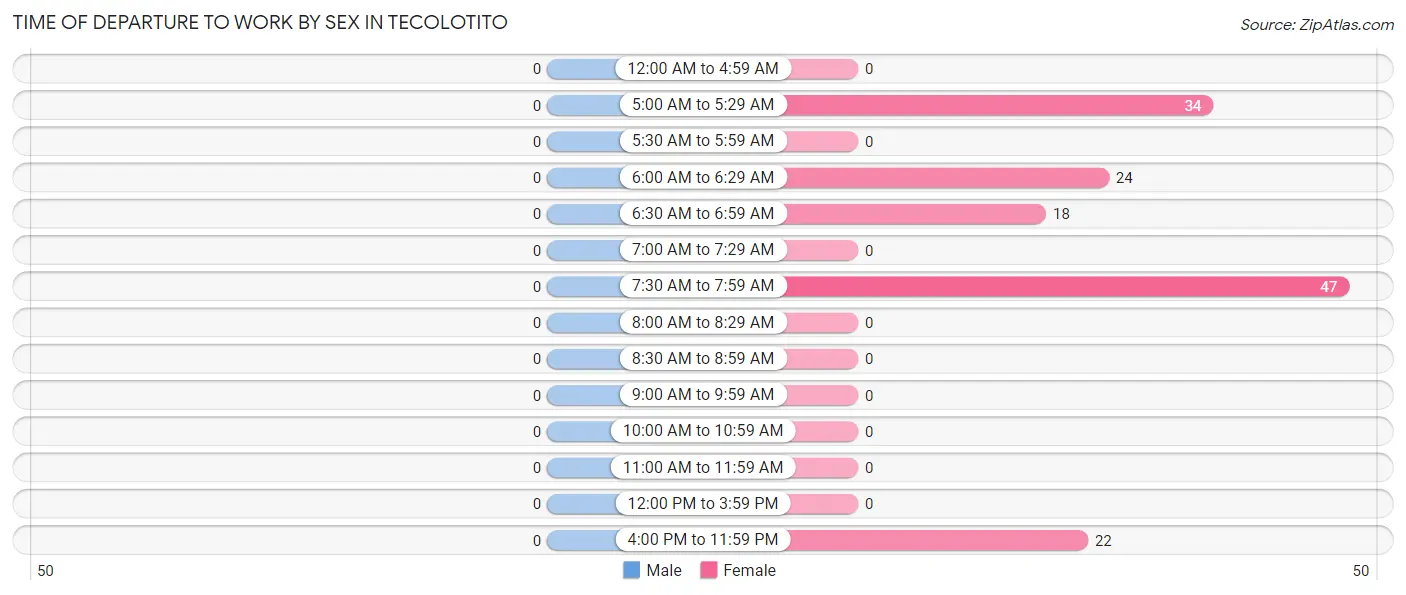
| Time of Departure | Male | Female |
| 12:00 AM to 4:59 AM | 0 (0.0%) | 0 (0.0%) |
| 5:00 AM to 5:29 AM | 0 (0.0%) | 34 (23.4%) |
| 5:30 AM to 5:59 AM | 0 (0.0%) | 0 (0.0%) |
| 6:00 AM to 6:29 AM | 0 (0.0%) | 24 (16.6%) |
| 6:30 AM to 6:59 AM | 0 (0.0%) | 18 (12.4%) |
| 7:00 AM to 7:29 AM | 0 (0.0%) | 0 (0.0%) |
| 7:30 AM to 7:59 AM | 0 (0.0%) | 47 (32.4%) |
| 8:00 AM to 8:29 AM | 0 (0.0%) | 0 (0.0%) |
| 8:30 AM to 8:59 AM | 0 (0.0%) | 0 (0.0%) |
| 9:00 AM to 9:59 AM | 0 (0.0%) | 0 (0.0%) |
| 10:00 AM to 10:59 AM | 0 (0.0%) | 0 (0.0%) |
| 11:00 AM to 11:59 AM | 0 (0.0%) | 0 (0.0%) |
| 12:00 PM to 3:59 PM | 0 (0.0%) | 0 (0.0%) |
| 4:00 PM to 11:59 PM | 0 (0.0%) | 22 (15.2%) |
| Total | 0 (0.0%) | 145 (100.0%) |
Housing Occupancy in Tecolotito
Occupancy by Ownership in Tecolotito
Of the total 134 dwellings in Tecolotito, owner-occupied units account for 134 (100.0%), while renter-occupied units make up 0 (0.0%).
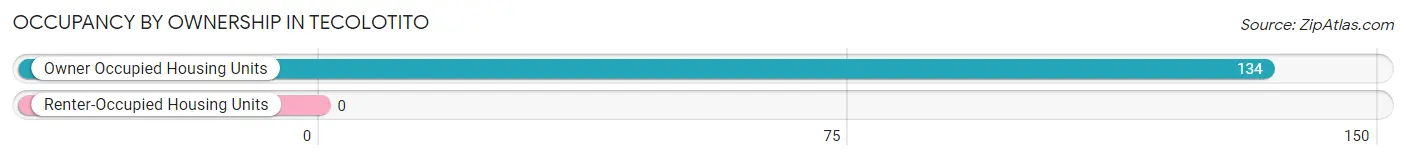
| Occupancy | # Housing Units | % Housing Units |
| Owner Occupied Housing Units | 134 | 100.0% |
| Renter-Occupied Housing Units | 0 | 0.0% |
| Total Occupied Housing Units | 134 | 100.0% |
Occupancy by Household Size in Tecolotito
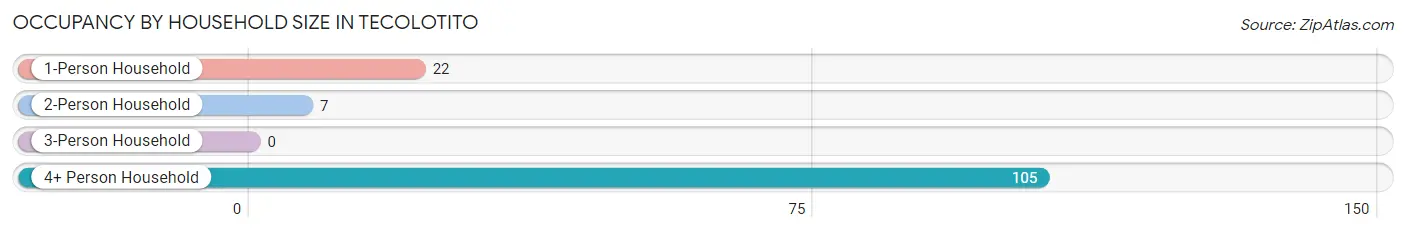
| Household Size | # Housing Units | % Housing Units |
| 1-Person Household | 22 | 16.4% |
| 2-Person Household | 7 | 5.2% |
| 3-Person Household | 0 | 0.0% |
| 4+ Person Household | 105 | 78.4% |
| Total Housing Units | 134 | 100.0% |
Occupancy by Ownership by Household Size in Tecolotito
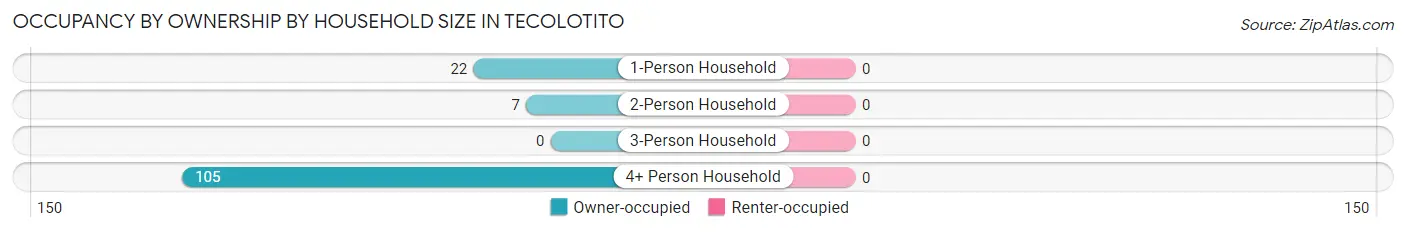
| Household Size | Owner-occupied | Renter-occupied |
| 1-Person Household | 22 (100.0%) | 0 (0.0%) |
| 2-Person Household | 7 (100.0%) | 0 (0.0%) |
| 3-Person Household | 0 (0.0%) | 0 (0.0%) |
| 4+ Person Household | 105 (100.0%) | 0 (0.0%) |
| Total Housing Units | 134 (100.0%) | 0 (0.0%) |
Occupancy by Educational Attainment in Tecolotito
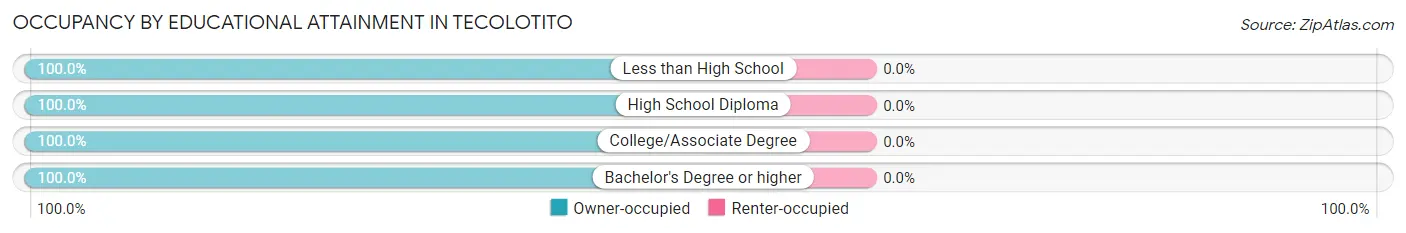
| Household Size | Owner-occupied | Renter-occupied |
| Less than High School | 34 (100.0%) | 0 (0.0%) |
| High School Diploma | 69 (100.0%) | 0 (0.0%) |
| College/Associate Degree | 24 (100.0%) | 0 (0.0%) |
| Bachelor's Degree or higher | 7 (100.0%) | 0 (0.0%) |
Occupancy by Age of Householder in Tecolotito
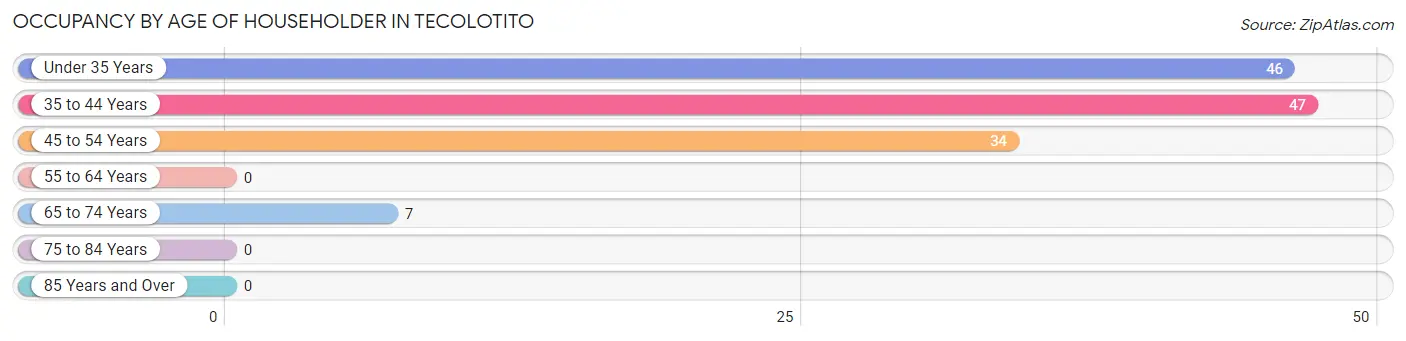
| Age Bracket | # Households | % Households |
| Under 35 Years | 46 | 34.3% |
| 35 to 44 Years | 47 | 35.1% |
| 45 to 54 Years | 34 | 25.4% |
| 55 to 64 Years | 0 | 0.0% |
| 65 to 74 Years | 7 | 5.2% |
| 75 to 84 Years | 0 | 0.0% |
| 85 Years and Over | 0 | 0.0% |
| Total | 134 | 100.0% |
Housing Finances in Tecolotito
Median Income by Occupancy in Tecolotito
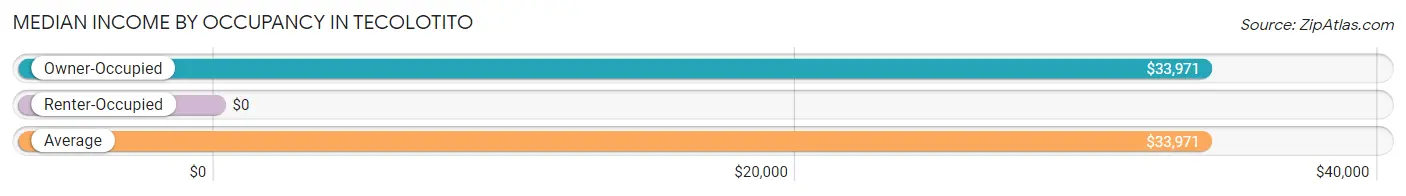
| Occupancy Type | # Households | Median Income |
| Owner-Occupied | 134 (100.0%) | $33,971 |
| Renter-Occupied | 0 (0.0%) | $0 |
| Average | 134 (100.0%) | $33,971 |
Occupancy by Householder Income Bracket in Tecolotito
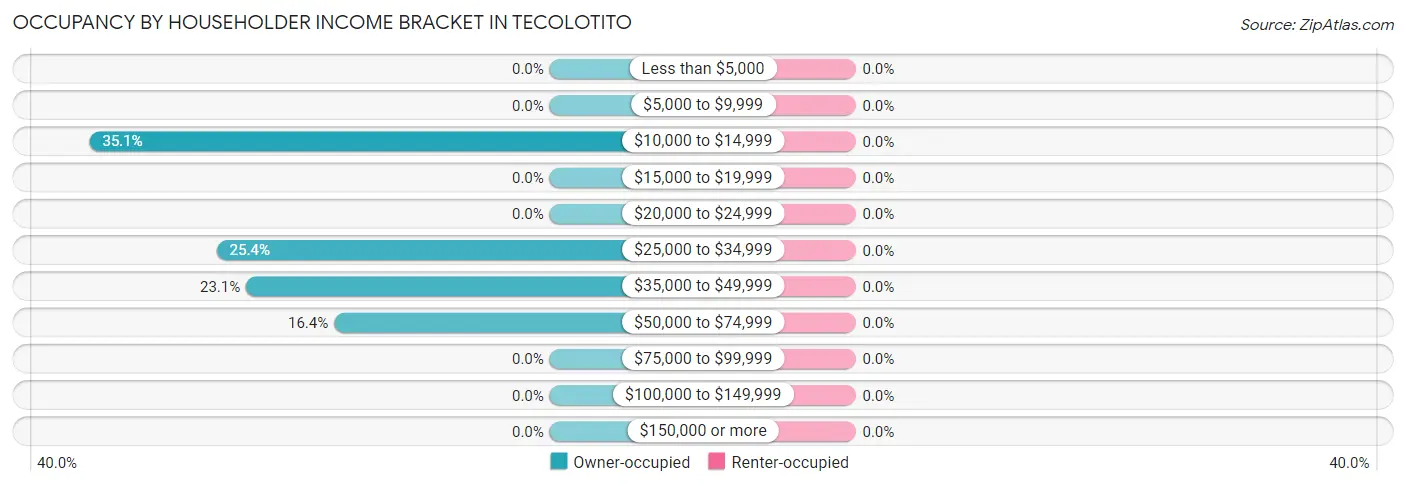
| Income Bracket | Owner-occupied | Renter-occupied |
| Less than $5,000 | 0 (0.0%) | 0 (0.0%) |
| $5,000 to $9,999 | 0 (0.0%) | 0 (0.0%) |
| $10,000 to $14,999 | 47 (35.1%) | 0 (0.0%) |
| $15,000 to $19,999 | 0 (0.0%) | 0 (0.0%) |
| $20,000 to $24,999 | 0 (0.0%) | 0 (0.0%) |
| $25,000 to $34,999 | 34 (25.4%) | 0 (0.0%) |
| $35,000 to $49,999 | 31 (23.1%) | 0 (0.0%) |
| $50,000 to $74,999 | 22 (16.4%) | 0 (0.0%) |
| $75,000 to $99,999 | 0 (0.0%) | 0 (0.0%) |
| $100,000 to $149,999 | 0 (0.0%) | 0 (0.0%) |
| $150,000 or more | 0 (0.0%) | 0 (0.0%) |
| Total | 134 (100.0%) | 0 (0.0%) |
Monthly Housing Cost Tiers in Tecolotito
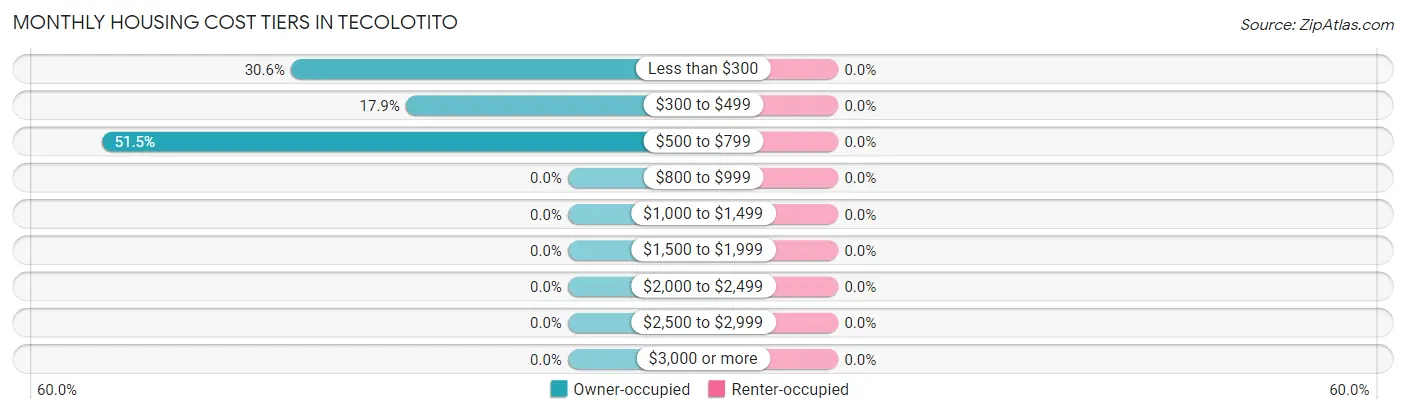
| Monthly Cost | Owner-occupied | Renter-occupied |
| Less than $300 | 41 (30.6%) | 0 (0.0%) |
| $300 to $499 | 24 (17.9%) | 0 (0.0%) |
| $500 to $799 | 69 (51.5%) | 0 (0.0%) |
| $800 to $999 | 0 (0.0%) | 0 (0.0%) |
| $1,000 to $1,499 | 0 (0.0%) | 0 (0.0%) |
| $1,500 to $1,999 | 0 (0.0%) | 0 (0.0%) |
| $2,000 to $2,499 | 0 (0.0%) | 0 (0.0%) |
| $2,500 to $2,999 | 0 (0.0%) | 0 (0.0%) |
| $3,000 or more | 0 (0.0%) | 0 (0.0%) |
| Total | 134 (100.0%) | 0 (0.0%) |
Physical Housing Characteristics in Tecolotito
Housing Structures in Tecolotito
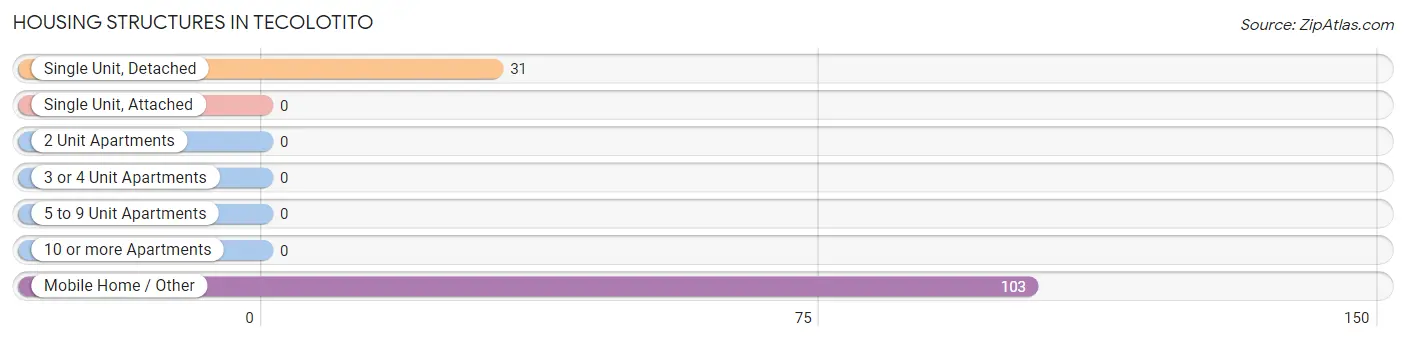
| Structure Type | # Housing Units | % Housing Units |
| Single Unit, Detached | 31 | 23.1% |
| Single Unit, Attached | 0 | 0.0% |
| 2 Unit Apartments | 0 | 0.0% |
| 3 or 4 Unit Apartments | 0 | 0.0% |
| 5 to 9 Unit Apartments | 0 | 0.0% |
| 10 or more Apartments | 0 | 0.0% |
| Mobile Home / Other | 103 | 76.9% |
| Total | 134 | 100.0% |
Housing Structures by Occupancy in Tecolotito
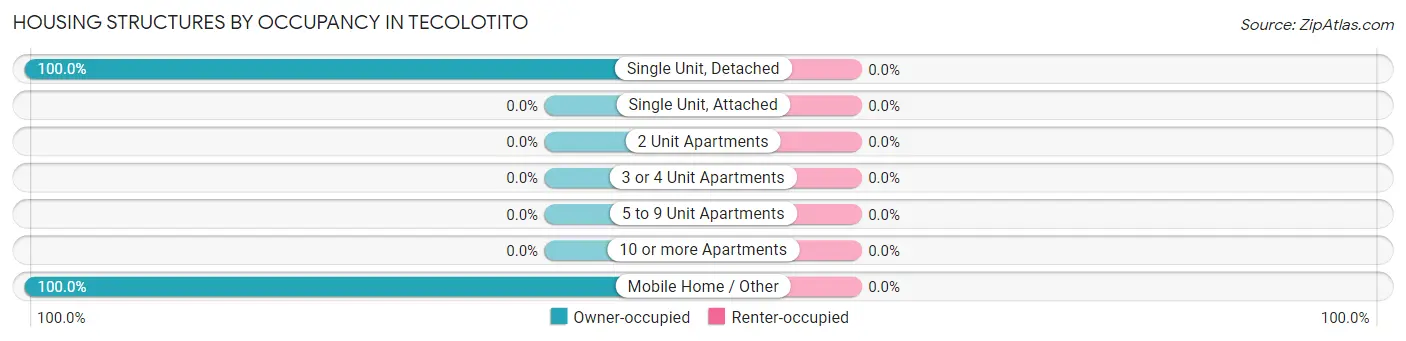
| Structure Type | Owner-occupied | Renter-occupied |
| Single Unit, Detached | 31 (100.0%) | 0 (0.0%) |
| Single Unit, Attached | 0 (0.0%) | 0 (0.0%) |
| 2 Unit Apartments | 0 (0.0%) | 0 (0.0%) |
| 3 or 4 Unit Apartments | 0 (0.0%) | 0 (0.0%) |
| 5 to 9 Unit Apartments | 0 (0.0%) | 0 (0.0%) |
| 10 or more Apartments | 0 (0.0%) | 0 (0.0%) |
| Mobile Home / Other | 103 (100.0%) | 0 (0.0%) |
| Total | 134 (100.0%) | 0 (0.0%) |
Housing Structures by Number of Rooms in Tecolotito
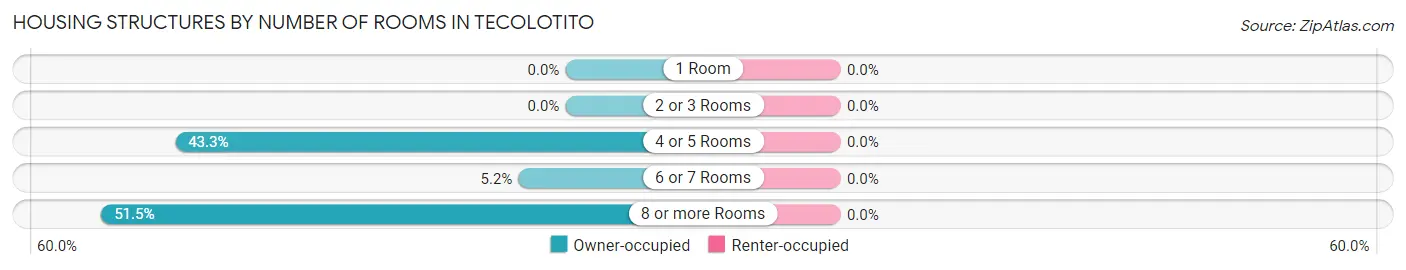
| Number of Rooms | Owner-occupied | Renter-occupied |
| 1 Room | 0 (0.0%) | 0 (0.0%) |
| 2 or 3 Rooms | 0 (0.0%) | 0 (0.0%) |
| 4 or 5 Rooms | 58 (43.3%) | 0 (0.0%) |
| 6 or 7 Rooms | 7 (5.2%) | 0 (0.0%) |
| 8 or more Rooms | 69 (51.5%) | 0 (0.0%) |
| Total | 134 (100.0%) | 0 (0.0%) |
Housing Structure by Heating Type in Tecolotito
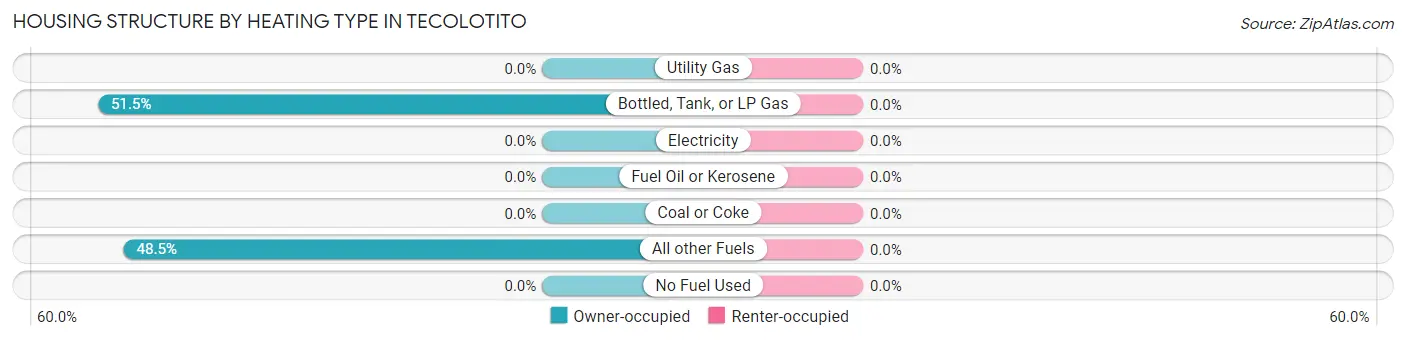
| Heating Type | Owner-occupied | Renter-occupied |
| Utility Gas | 0 (0.0%) | 0 (0.0%) |
| Bottled, Tank, or LP Gas | 69 (51.5%) | 0 (0.0%) |
| Electricity | 0 (0.0%) | 0 (0.0%) |
| Fuel Oil or Kerosene | 0 (0.0%) | 0 (0.0%) |
| Coal or Coke | 0 (0.0%) | 0 (0.0%) |
| All other Fuels | 65 (48.5%) | 0 (0.0%) |
| No Fuel Used | 0 (0.0%) | 0 (0.0%) |
| Total | 134 (100.0%) | 0 (0.0%) |
Household Vehicle Usage in Tecolotito
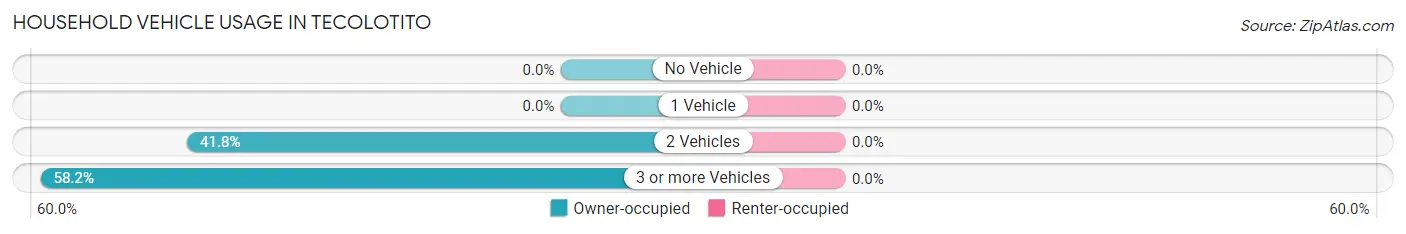
| Vehicles per Household | Owner-occupied | Renter-occupied |
| No Vehicle | 0 (0.0%) | 0 (0.0%) |
| 1 Vehicle | 0 (0.0%) | 0 (0.0%) |
| 2 Vehicles | 56 (41.8%) | 0 (0.0%) |
| 3 or more Vehicles | 78 (58.2%) | 0 (0.0%) |
| Total | 134 (100.0%) | 0 (0.0%) |
Real Estate & Mortgages in Tecolotito
Real Estate and Mortgage Overview in Tecolotito
| Characteristic | Without Mortgage | With Mortgage |
| Housing Units | 134 | 0 |
| Median Property Value | $9,999 | $0 |
| Median Household Income | $33,971 | $0 |
| Monthly Housing Costs | $509 | $0 |
| Real Estate Taxes | $199 | $0 |
Property Value by Mortgage Status in Tecolotito
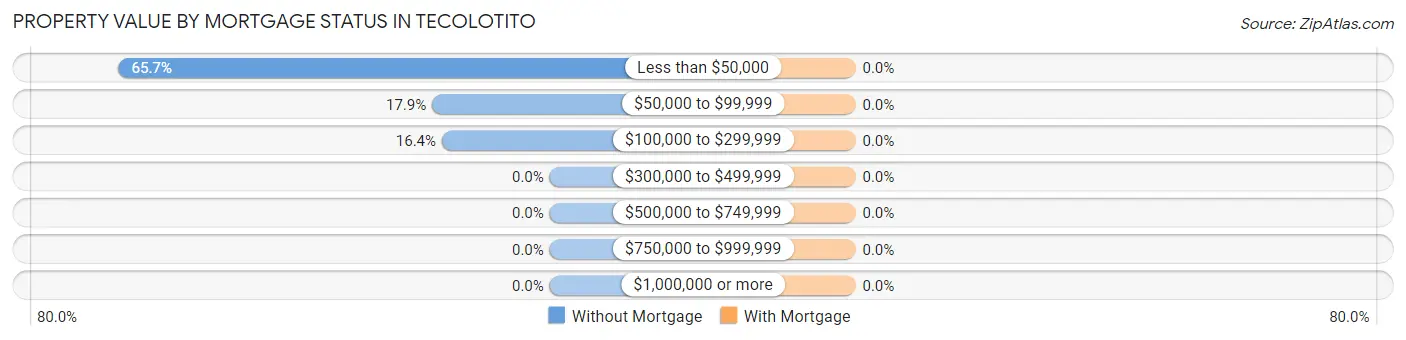
| Property Value | Without Mortgage | With Mortgage |
| Less than $50,000 | 88 (65.7%) | 0 (0.0%) |
| $50,000 to $99,999 | 24 (17.9%) | 0 (0.0%) |
| $100,000 to $299,999 | 22 (16.4%) | 0 (0.0%) |
| $300,000 to $499,999 | 0 (0.0%) | 0 (0.0%) |
| $500,000 to $749,999 | 0 (0.0%) | 0 (0.0%) |
| $750,000 to $999,999 | 0 (0.0%) | 0 (0.0%) |
| $1,000,000 or more | 0 (0.0%) | 0 (0.0%) |
| Total | 134 (100.0%) | 0 (0.0%) |
Household Income by Mortgage Status in Tecolotito
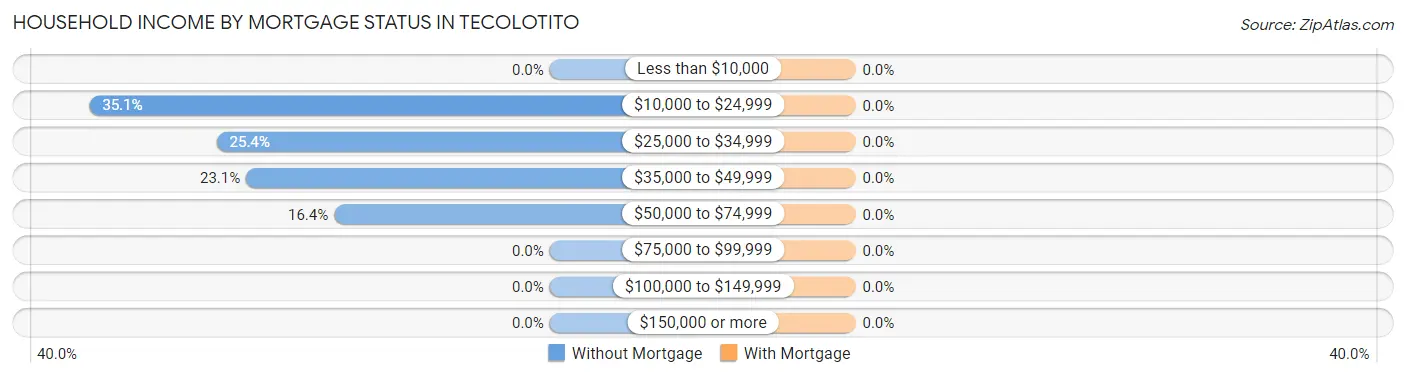
| Household Income | Without Mortgage | With Mortgage |
| Less than $10,000 | 0 (0.0%) | 0 (0.0%) |
| $10,000 to $24,999 | 47 (35.1%) | 0 (0.0%) |
| $25,000 to $34,999 | 34 (25.4%) | 0 (0.0%) |
| $35,000 to $49,999 | 31 (23.1%) | 0 (0.0%) |
| $50,000 to $74,999 | 22 (16.4%) | 0 (0.0%) |
| $75,000 to $99,999 | 0 (0.0%) | 0 (0.0%) |
| $100,000 to $149,999 | 0 (0.0%) | 0 (0.0%) |
| $150,000 or more | 0 (0.0%) | 0 (0.0%) |
| Total | 134 (100.0%) | 0 (0.0%) |
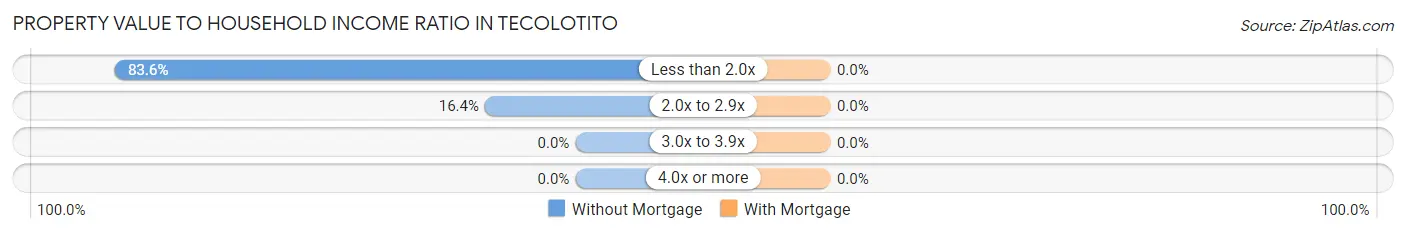
Property Value to Household Income Ratio in Tecolotito
| Value-to-Income Ratio | Without Mortgage | With Mortgage |
| Less than 2.0x | 112 (83.6%) | 0 (0.0%) |
| 2.0x to 2.9x | 22 (16.4%) | 0 (0.0%) |
| 3.0x to 3.9x | 0 (0.0%) | 0 (0.0%) |
| 4.0x or more | 0 (0.0%) | 0 (0.0%) |
| Total | 134 (100.0%) | 0 (0.0%) |
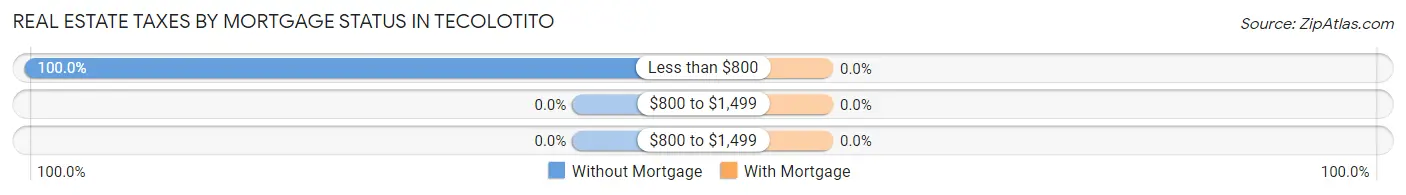
Real Estate Taxes by Mortgage Status in Tecolotito
| Property Taxes | Without Mortgage | With Mortgage |
| Less than $800 | 134 (100.0%) | 0 (0.0%) |
| $800 to $1,499 | 0 (0.0%) | 0 (0.0%) |
| $800 to $1,499 | 0 (0.0%) | 0 (0.0%) |
| Total | 134 (100.0%) | 0 (0.0%) |
Health & Disability in Tecolotito
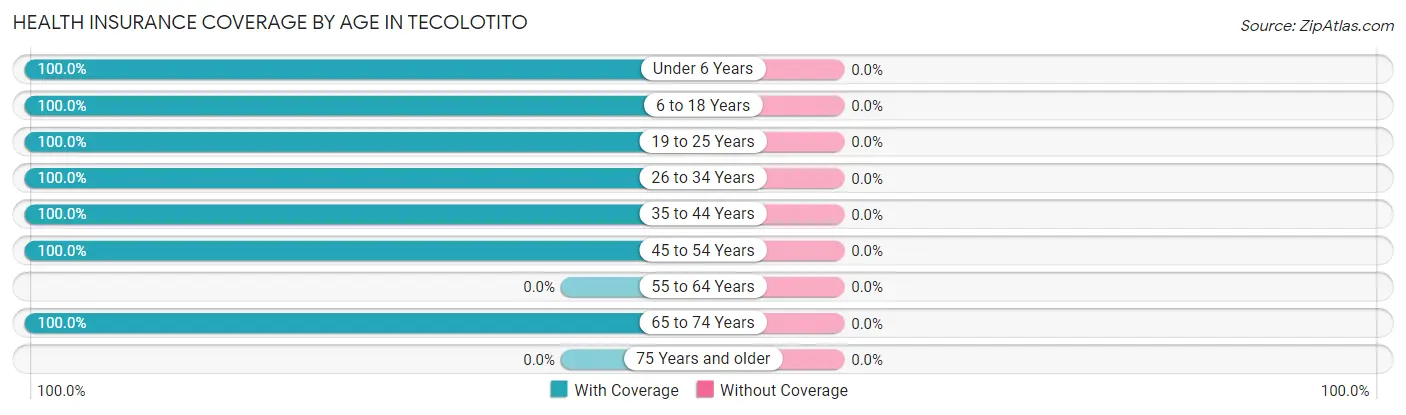
Health Insurance Coverage by Age in Tecolotito
| Age Bracket | With Coverage | Without Coverage |
| Under 6 Years | 32 (100.0%) | 0 (0.0%) |
| 6 to 18 Years | 208 (100.0%) | 0 (0.0%) |
| 19 to 25 Years | 46 (100.0%) | 0 (0.0%) |
| 26 to 34 Years | 46 (100.0%) | 0 (0.0%) |
| 35 to 44 Years | 116 (100.0%) | 0 (0.0%) |
| 45 to 54 Years | 34 (100.0%) | 0 (0.0%) |
| 55 to 64 Years | 0 (0.0%) | 0 (0.0%) |
| 65 to 74 Years | 14 (100.0%) | 0 (0.0%) |
| 75 Years and older | 0 (0.0%) | 0 (0.0%) |
| Total | 496 (100.0%) | 0 (0.0%) |
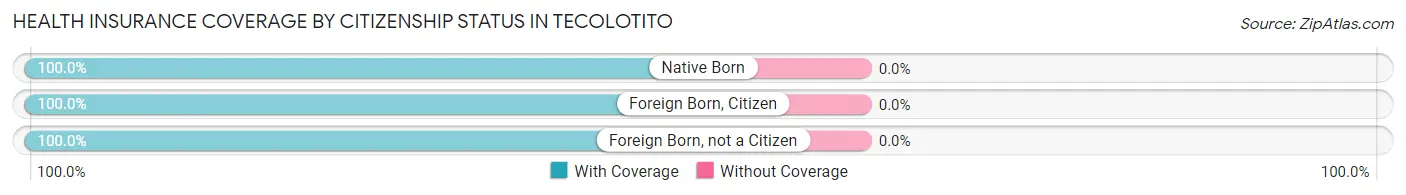
Health Insurance Coverage by Citizenship Status in Tecolotito
| Citizenship Status | With Coverage | Without Coverage |
| Native Born | 32 (100.0%) | 0 (0.0%) |
| Foreign Born, Citizen | 208 (100.0%) | 0 (0.0%) |
| Foreign Born, not a Citizen | 46 (100.0%) | 0 (0.0%) |
Health Insurance Coverage by Household Income in Tecolotito
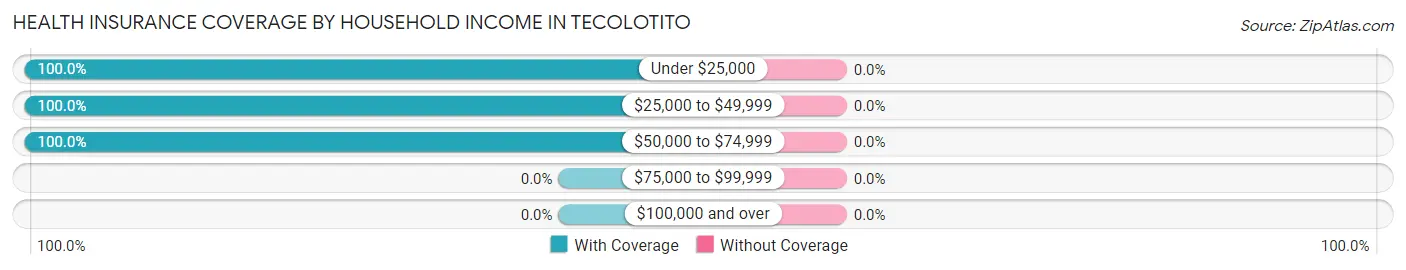
| Household Income | With Coverage | Without Coverage |
| Under $25,000 | 234 (100.0%) | 0 (0.0%) |
| $25,000 to $49,999 | 240 (100.0%) | 0 (0.0%) |
| $50,000 to $74,999 | 22 (100.0%) | 0 (0.0%) |
| $75,000 to $99,999 | 0 (0.0%) | 0 (0.0%) |
| $100,000 and over | 0 (0.0%) | 0 (0.0%) |
Public vs Private Health Insurance Coverage by Age in Tecolotito
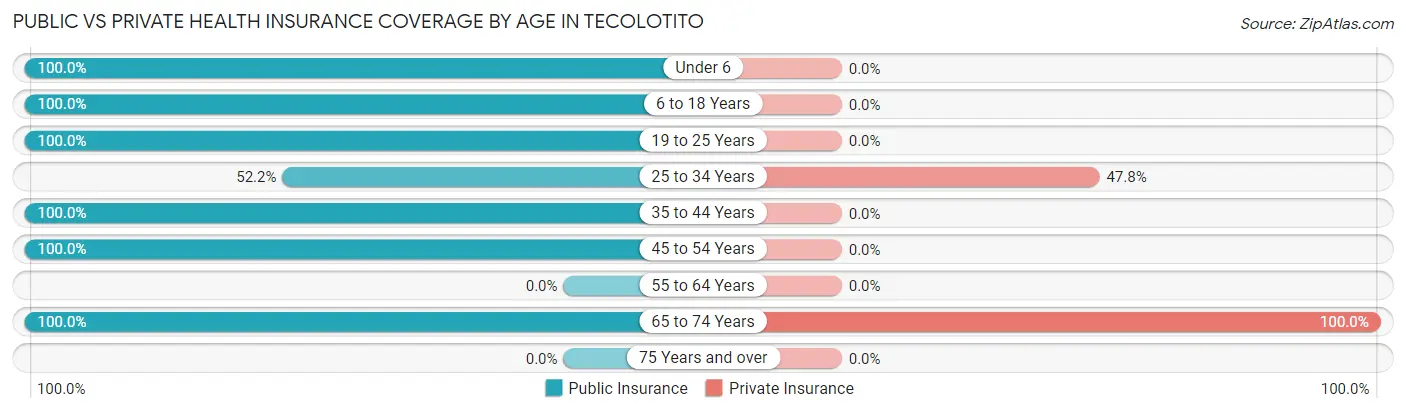
| Age Bracket | Public Insurance | Private Insurance |
| Under 6 | 32 (100.0%) | 0 (0.0%) |
| 6 to 18 Years | 208 (100.0%) | 0 (0.0%) |
| 19 to 25 Years | 46 (100.0%) | 0 (0.0%) |
| 25 to 34 Years | 24 (52.2%) | 22 (47.8%) |
| 35 to 44 Years | 116 (100.0%) | 0 (0.0%) |
| 45 to 54 Years | 34 (100.0%) | 0 (0.0%) |
| 55 to 64 Years | 0 (0.0%) | 0 (0.0%) |
| 65 to 74 Years | 14 (100.0%) | 14 (100.0%) |
| 75 Years and over | 0 (0.0%) | 0 (0.0%) |
| Total | 474 (95.6%) | 36 (7.3%) |
Disability Status by Sex by Age in Tecolotito
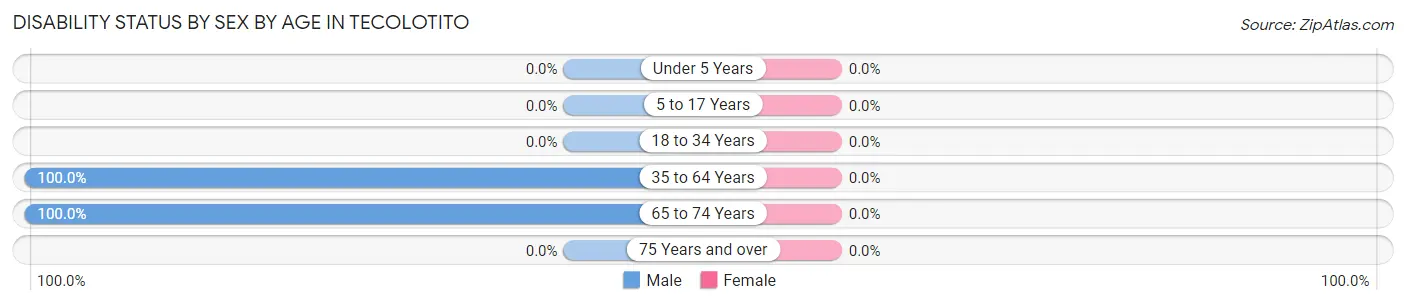
| Age Bracket | Male | Female |
| Under 5 Years | 0 (0.0%) | 0 (0.0%) |
| 5 to 17 Years | 0 (0.0%) | 0 (0.0%) |
| 18 to 34 Years | 0 (0.0%) | 0 (0.0%) |
| 35 to 64 Years | 69 (100.0%) | 0 (0.0%) |
| 65 to 74 Years | 7 (100.0%) | 0 (0.0%) |
| 75 Years and over | 0 (0.0%) | 0 (0.0%) |
Disability Class by Sex by Age in Tecolotito
Disability Class: Hearing Difficulty
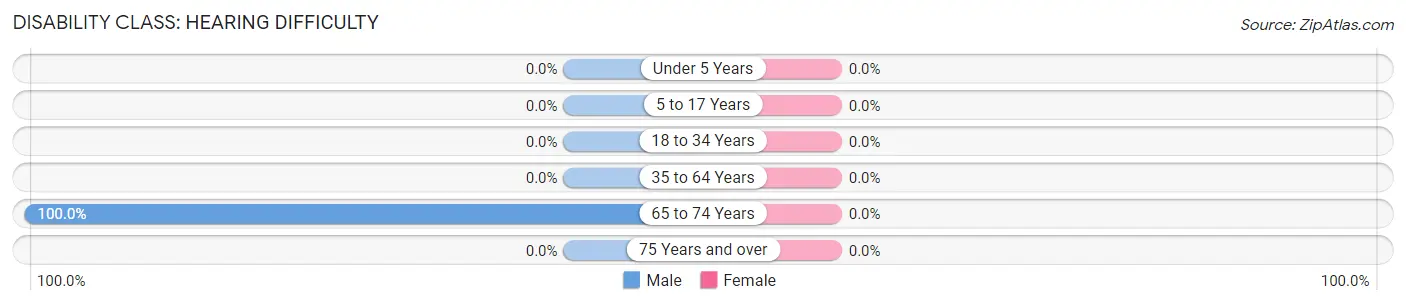
| Age Bracket | Male | Female |
| Under 5 Years | 0 (0.0%) | 0 (0.0%) |
| 5 to 17 Years | 0 (0.0%) | 0 (0.0%) |
| 18 to 34 Years | 0 (0.0%) | 0 (0.0%) |
| 35 to 64 Years | 0 (0.0%) | 0 (0.0%) |
| 65 to 74 Years | 7 (100.0%) | 0 (0.0%) |
| 75 Years and over | 0 (0.0%) | 0 (0.0%) |
Disability Class: Vision Difficulty
| Age Bracket | Male | Female |
| Under 5 Years | 0 (0.0%) | 0 (0.0%) |
| 5 to 17 Years | 0 (0.0%) | 0 (0.0%) |
| 18 to 34 Years | 0 (0.0%) | 0 (0.0%) |
| 35 to 64 Years | 0 (0.0%) | 0 (0.0%) |
| 65 to 74 Years | 0 (0.0%) | 0 (0.0%) |
| 75 Years and over | 0 (0.0%) | 0 (0.0%) |
Disability Class: Cognitive Difficulty
| Age Bracket | Male | Female |
| 5 to 17 Years | 0 (0.0%) | 0 (0.0%) |
| 18 to 34 Years | 0 (0.0%) | 0 (0.0%) |
| 35 to 64 Years | 69 (100.0%) | 0 (0.0%) |
| 65 to 74 Years | 0 (0.0%) | 0 (0.0%) |
| 75 Years and over | 0 (0.0%) | 0 (0.0%) |
Disability Class: Ambulatory Difficulty
| Age Bracket | Male | Female |
| 5 to 17 Years | 0 (0.0%) | 0 (0.0%) |
| 18 to 34 Years | 0 (0.0%) | 0 (0.0%) |
| 35 to 64 Years | 0 (0.0%) | 0 (0.0%) |
| 65 to 74 Years | 0 (0.0%) | 0 (0.0%) |
| 75 Years and over | 0 (0.0%) | 0 (0.0%) |
Disability Class: Self-Care Difficulty
| Age Bracket | Male | Female |
| 5 to 17 Years | 0 (0.0%) | 0 (0.0%) |
| 18 to 34 Years | 0 (0.0%) | 0 (0.0%) |
| 35 to 64 Years | 0 (0.0%) | 0 (0.0%) |
| 65 to 74 Years | 0 (0.0%) | 0 (0.0%) |
| 75 Years and over | 0 (0.0%) | 0 (0.0%) |
Technology Access in Tecolotito
Computing Device Access in Tecolotito
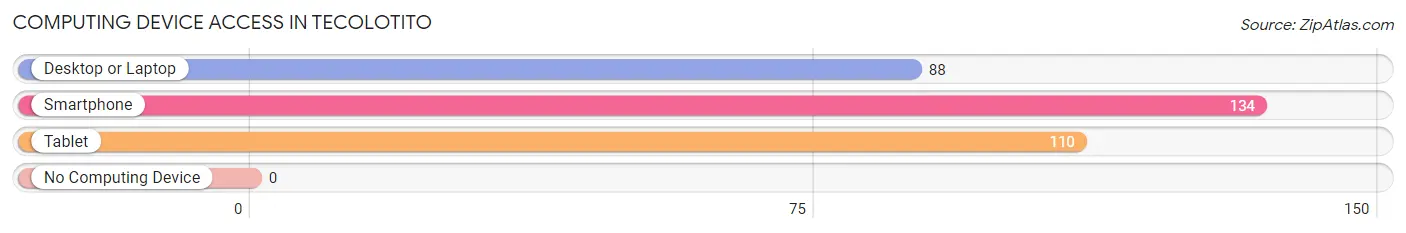
| Device Type | # Households | % Households |
| Desktop or Laptop | 88 | 65.7% |
| Smartphone | 134 | 100.0% |
| Tablet | 110 | 82.1% |
| No Computing Device | 0 | 0.0% |
| Total | 134 | 100.0% |
Internet Access in Tecolotito
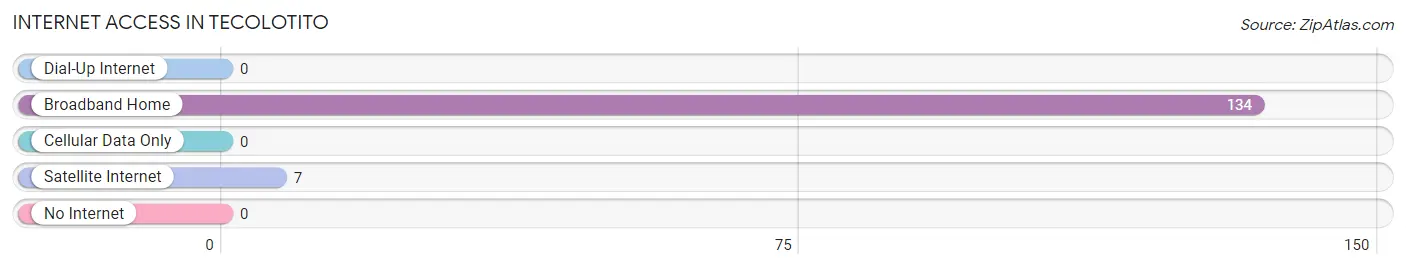
| Internet Type | # Households | % Households |
| Dial-Up Internet | 0 | 0.0% |
| Broadband Home | 134 | 100.0% |
| Cellular Data Only | 0 | 0.0% |
| Satellite Internet | 7 | 5.2% |
| No Internet | 0 | 0.0% |
| Total | 134 | 100.0% |
Tecolotito Summary
Tecolotito is a small unincorporated community located in San Miguel County, New Mexico. It is situated in the foothills of the Sangre de Cristo Mountains, approximately 15 miles south of Las Vegas, New Mexico. The community is located along the historic Santa Fe Trail and is home to a variety of wildlife, including deer, elk, and antelope.
Geography
Tecolotito is located in the foothills of the Sangre de Cristo Mountains, approximately 15 miles south of Las Vegas, New Mexico. The community is situated at an elevation of 6,400 feet and is surrounded by rolling hills and grasslands. The area is characterized by a semi-arid climate, with hot summers and cold winters. The average annual precipitation is approximately 12 inches.
The community is located along the historic Santa Fe Trail, which was used by Native Americans, Spanish explorers, and settlers in the 19th century. The trail is now a popular destination for hikers, bikers, and horseback riders.
Economy
Tecolotito is a small, rural community with a population of approximately 200 people. The primary economic activity in the area is ranching and farming. The community is home to several small businesses, including a general store, a gas station, and a restaurant.
Demographics
As of the 2010 census, the population of Tecolotito was 200 people. The racial makeup of the community was 95.5% White, 0.5% African American, 0.5% Native American, 0.5% Asian, and 3% from other races. The median household income was $25,000, and the median age was 44 years.
Conclusion
Tecolotito is a small, rural community located in the foothills of the Sangre de Cristo Mountains in San Miguel County, New Mexico. The community is situated along the historic Santa Fe Trail and is home to a variety of wildlife. The primary economic activity in the area is ranching and farming, and the population is primarily White. Tecolotito is a peaceful and picturesque community that offers a unique glimpse into the history and culture of the Southwest.
Common Questions
What is the Total Population of Tecolotito?
Total Population of Tecolotito is 496.
What is the Total Male Population of Tecolotito?
Total Male Population of Tecolotito is 131.
What is the Total Female Population of Tecolotito?
Total Female Population of Tecolotito is 365.
What is the Ratio of Males per 100 Females in Tecolotito?
There are 35.89 Males per 100 Females in Tecolotito.
What is the Ratio of Females per 100 Males in Tecolotito?
There are 278.63 Females per 100 Males in Tecolotito.
What is the Median Population Age in Tecolotito?
Median Population Age in Tecolotito is 19.3 Years.
What is the Average Family Size in Tecolotito
Average Family Size in Tecolotito is 3.5 People.
What is the Average Household Size in Tecolotito
Average Household Size in Tecolotito is 3.7 People.
What is Per Capita Income in Tecolotito?
Per Capita income in Tecolotito is $9,009.
What is the Median Household income in Tecolotito?
Median Household Income in Tecolotito is $33,971.
What is Inequality or Gini Index in Tecolotito?
Inequality or Gini Index in Tecolotito is 0.29.
How Large is the Labor Force in Tecolotito?
There are 173 People in the Labor Forcein in Tecolotito.
What is the Percentage of People in the Labor Force in Tecolotito?
52.9% of People are in the Labor Force in Tecolotito.
What is the Unemployment Rate in Tecolotito?
Unemployment Rate in Tecolotito is 16.2%.