Canova, NM
Canova Map
Canova Overview
589
TOTAL POPULATION
341
MALE POPULATION
248
FEMALE POPULATION
137.50
MALES / 100 FEMALES
72.73
FEMALES / 100 MALES
30.8
MEDIAN AGE
4.3
AVG FAMILY SIZE
2.8
AVG HOUSEHOLD SIZE
$42,237
PER CAPITA INCOME
0.32
INEQUALITY / GINI INDEX
296
LABOR FORCE [ PEOPLE ]
58.2%
PERCENT IN LABOR FORCE
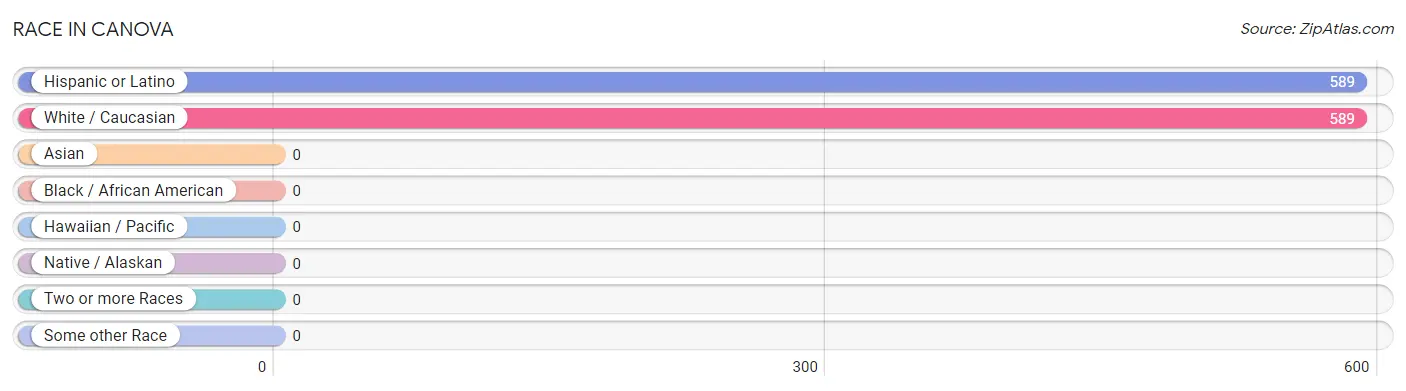
Race in Canova
The most populous races in Canova are Hispanic or Latino (589 | 100.0%), and White / Caucasian (589 | 100.0%).
| Race | # Population | % Population |
| Asian | 0 | 0.0% |
| Black / African American | 0 | 0.0% |
| Hawaiian / Pacific | 0 | 0.0% |
| Hispanic or Latino | 589 | 100.0% |
| Native / Alaskan | 0 | 0.0% |
| White / Caucasian | 589 | 100.0% |
| Two or more Races | 0 | 0.0% |
| Some other Race | 0 | 0.0% |
| Total | 589 | 100.0% |
Ancestry in Canova
The most populous ancestries reported in Canova are , and Spanish (426 | 72.3%), together accounting for 72.3% of all Canova residents.

| Ancestry | # Population | % Population |
| Spanish | 426 | 72.3% | View All 1 Rows |
Immigrants in Canova

| Immigration Origin | # Population | % Population | View All 0 Rows |
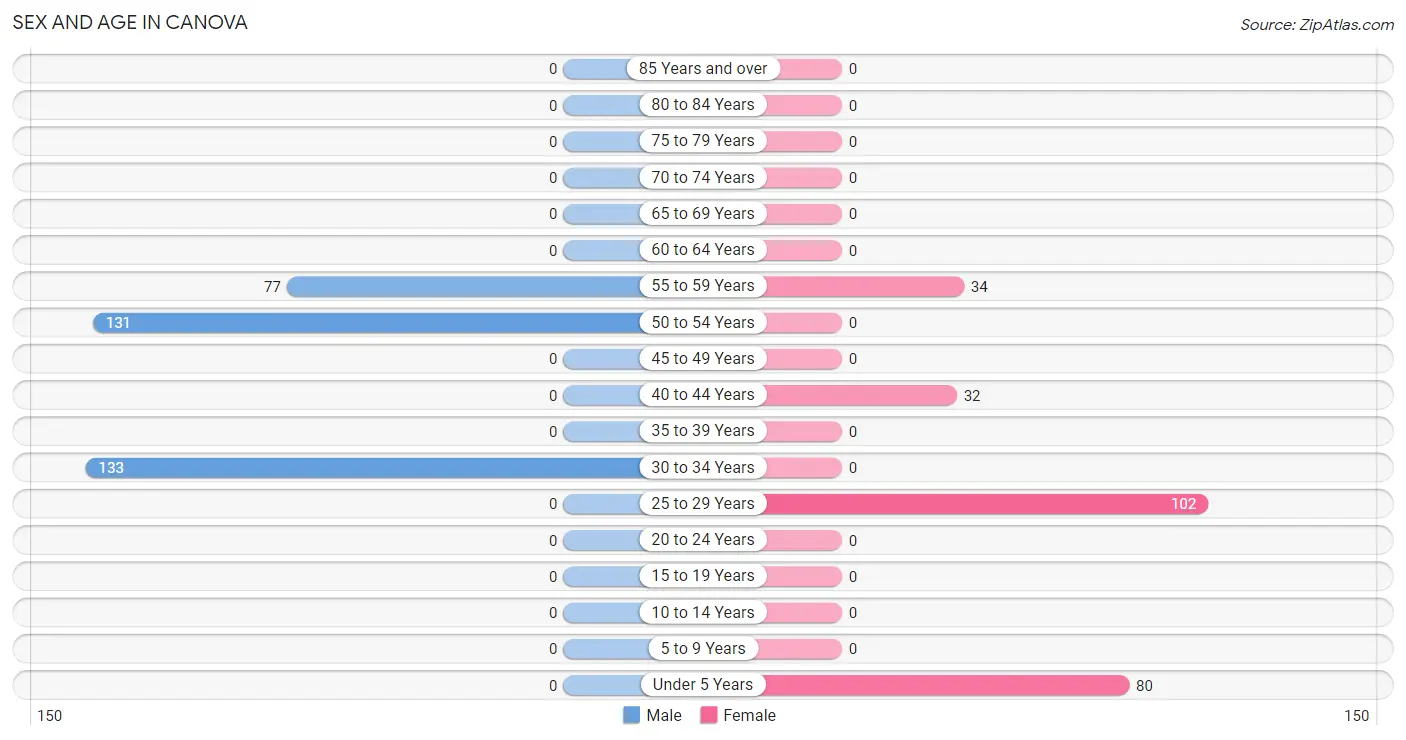
Sex and Age in Canova
Sex and Age in Canova
The most populous age groups in Canova are 30 to 34 Years (133 | 39.0%) for men and 25 to 29 Years (102 | 41.1%) for women.
| Age Bracket | Male | Female |
| Under 5 Years | 0 (0.0%) | 80 (32.3%) |
| 5 to 9 Years | 0 (0.0%) | 0 (0.0%) |
| 10 to 14 Years | 0 (0.0%) | 0 (0.0%) |
| 15 to 19 Years | 0 (0.0%) | 0 (0.0%) |
| 20 to 24 Years | 0 (0.0%) | 0 (0.0%) |
| 25 to 29 Years | 0 (0.0%) | 102 (41.1%) |
| 30 to 34 Years | 133 (39.0%) | 0 (0.0%) |
| 35 to 39 Years | 0 (0.0%) | 0 (0.0%) |
| 40 to 44 Years | 0 (0.0%) | 32 (12.9%) |
| 45 to 49 Years | 0 (0.0%) | 0 (0.0%) |
| 50 to 54 Years | 131 (38.4%) | 0 (0.0%) |
| 55 to 59 Years | 77 (22.6%) | 34 (13.7%) |
| 60 to 64 Years | 0 (0.0%) | 0 (0.0%) |
| 65 to 69 Years | 0 (0.0%) | 0 (0.0%) |
| 70 to 74 Years | 0 (0.0%) | 0 (0.0%) |
| 75 to 79 Years | 0 (0.0%) | 0 (0.0%) |
| 80 to 84 Years | 0 (0.0%) | 0 (0.0%) |
| 85 Years and over | 0 (0.0%) | 0 (0.0%) |
| Total | 341 (100.0%) | 248 (100.0%) |
Families and Households in Canova
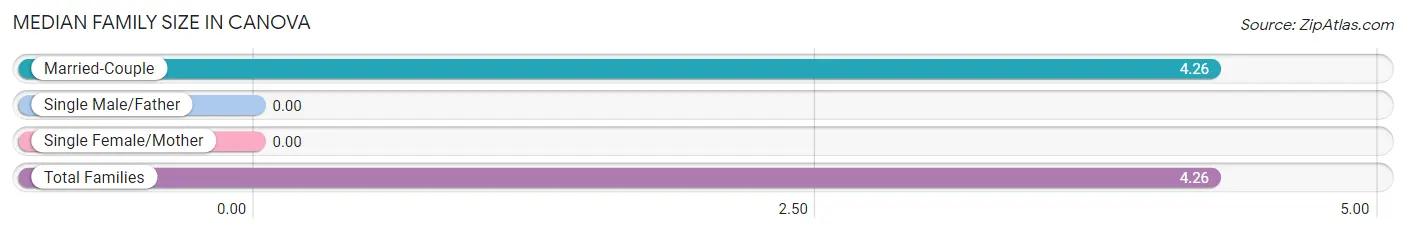
Median Family Size in Canova
| Family Type | # Families | Family Size |
| Married-Couple | 117 (100.0%) | 4.26 |
| Single Male/Father | 0 (0.0%) | - |
| Single Female/Mother | 0 (0.0%) | - |
| Total Families | 117 (100.0%) | 4.26 |
Median Household Size in Canova

| Household Type | # Households | Household Size |
| Married-Couple | 117 (56.2%) | 4.26 |
| Single Male/Father | 0 (0.0%) | - |
| Single Female/Mother | 0 (0.0%) | - |
| Non-family | 91 (43.8%) | - |
| Total Households | 208 (100.0%) | 2.83 |
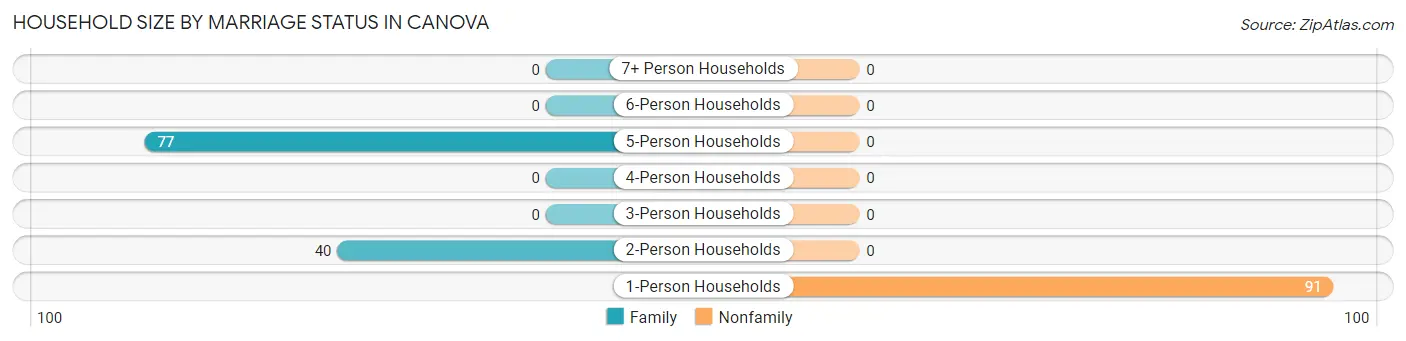
Household Size by Marriage Status in Canova
Out of a total of 208 households in Canova, 117 (56.2%) are family households, while 91 (43.8%) are nonfamily households. The most numerous type of family households are 5-person households, comprising 77, and the most common type of nonfamily households are 1-person households, comprising 91.
| Household Size | Family Households | Nonfamily Households |
| 1-Person Households | - | 91 (43.8%) |
| 2-Person Households | 40 (19.2%) | 0 (0.0%) |
| 3-Person Households | 0 (0.0%) | 0 (0.0%) |
| 4-Person Households | 0 (0.0%) | 0 (0.0%) |
| 5-Person Households | 77 (37.0%) | 0 (0.0%) |
| 6-Person Households | 0 (0.0%) | 0 (0.0%) |
| 7+ Person Households | 0 (0.0%) | 0 (0.0%) |
| Total | 117 (56.2%) | 91 (43.8%) |
Female Fertility in Canova
Fertility by Age in Canova
| Age Bracket | Women with Births | Births / 1,000 Women |
| 15 to 19 years | 0 (0.0%) | 0.0 |
| 20 to 34 years | 0 (0.0%) | 0.0 |
| 35 to 50 years | 0 (0.0%) | 0.0 |
| Total | 0 (0.0%) | 0.0 |
Fertility by Age by Marriage Status in Canova
| Age Bracket | Married | Unmarried |
| 15 to 19 years | 0 (0.0%) | 0 (0.0%) |
| 20 to 34 years | 0 (0.0%) | 0 (0.0%) |
| 35 to 50 years | 0 (0.0%) | 0 (0.0%) |
| Total | 0 (0.0%) | 0 (0.0%) |
Fertility by Education in Canova
| Educational Attainment | Women with Births | Births / 1,000 Women |
| Less than High School | 0 (0.0%) | 0.0 |
| High School Diploma | 0 (0.0%) | 0.0 |
| College or Associate's Degree | 0 (0.0%) | 0.0 |
| Bachelor's Degree | 0 (0.0%) | 0.0 |
| Graduate Degree | 0 (0.0%) | 0.0 |
| Total | 0 (0.0%) | 0.0 |
Fertility by Education by Marriage Status in Canova
| Educational Attainment | Married | Unmarried |
| Less than High School | 0 (0.0%) | 0 (0.0%) |
| High School Diploma | 0 (0.0%) | 0 (0.0%) |
| College or Associate's Degree | 0 (0.0%) | 0 (0.0%) |
| Bachelor's Degree | 0 (0.0%) | 0 (0.0%) |
| Graduate Degree | 0 (0.0%) | 0 (0.0%) |
| Total | 0 (0.0%) | 0 (0.0%) |
Income in Canova
Income Overview in Canova
| Characteristic | Number | Measure |
| Per Capita Income | 589 | $42,237 |
| Median Family Income | 117 | $0 |
| Mean Family Income | 117 | $0 |
| Median Household Income | 208 | $0 |
| Mean Household Income | 208 | $117,134 |
| Income Deficit | 117 | $0 |
| Wage / Income Gap (%) | 589 | 0.00% |
| Wage / Income Gap ($) | 589 | 100.00¢ per $1 |
| Gini / Inequality Index | 589 | 0.32 |
Earnings by Sex in Canova

| Sex | Number | Average Earnings |
| Male | 264 (89.2%) | $67,519 |
| Female | 32 (10.8%) | $0 |
| Total | 296 (100.0%) | $48,828 |
Earnings by Sex by Income Bracket in Canova
The most common earnings brackets in Canova are $65,000 to $74,999 for men (133 | 50.4%) and $45,000 to $49,999 for women (32 | 100.0%).
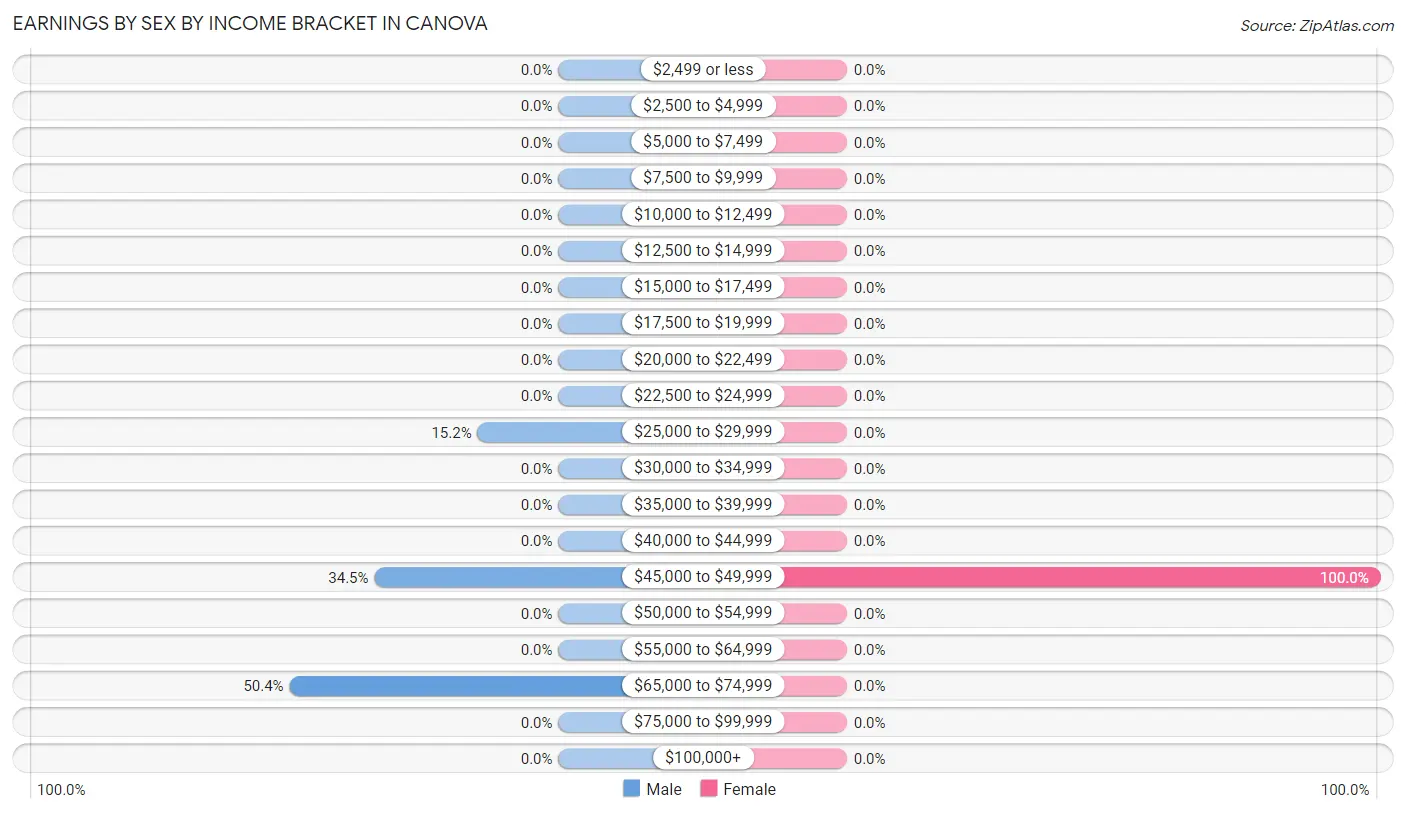
| Income | Male | Female |
| $2,499 or less | 0 (0.0%) | 0 (0.0%) |
| $2,500 to $4,999 | 0 (0.0%) | 0 (0.0%) |
| $5,000 to $7,499 | 0 (0.0%) | 0 (0.0%) |
| $7,500 to $9,999 | 0 (0.0%) | 0 (0.0%) |
| $10,000 to $12,499 | 0 (0.0%) | 0 (0.0%) |
| $12,500 to $14,999 | 0 (0.0%) | 0 (0.0%) |
| $15,000 to $17,499 | 0 (0.0%) | 0 (0.0%) |
| $17,500 to $19,999 | 0 (0.0%) | 0 (0.0%) |
| $20,000 to $22,499 | 0 (0.0%) | 0 (0.0%) |
| $22,500 to $24,999 | 0 (0.0%) | 0 (0.0%) |
| $25,000 to $29,999 | 40 (15.1%) | 0 (0.0%) |
| $30,000 to $34,999 | 0 (0.0%) | 0 (0.0%) |
| $35,000 to $39,999 | 0 (0.0%) | 0 (0.0%) |
| $40,000 to $44,999 | 0 (0.0%) | 0 (0.0%) |
| $45,000 to $49,999 | 91 (34.5%) | 32 (100.0%) |
| $50,000 to $54,999 | 0 (0.0%) | 0 (0.0%) |
| $55,000 to $64,999 | 0 (0.0%) | 0 (0.0%) |
| $65,000 to $74,999 | 133 (50.4%) | 0 (0.0%) |
| $75,000 to $99,999 | 0 (0.0%) | 0 (0.0%) |
| $100,000+ | 0 (0.0%) | 0 (0.0%) |
| Total | 264 (100.0%) | 32 (100.0%) |
Earnings by Sex by Educational Attainment in Canova
| Educational Attainment | Male Income | Female Income |
| Less than High School | - | - |
| High School Diploma | - | - |
| College or Associate's Degree | - | - |
| Bachelor's Degree | - | - |
| Graduate Degree | - | - |
| Total | $67,519 | $0 |
Family Income in Canova
Family Income Brackets in Canova
According to the Canova family income data, there are 77 families falling into the $200,000+ income range, which is the most common income bracket and makes up 65.8% of all families.
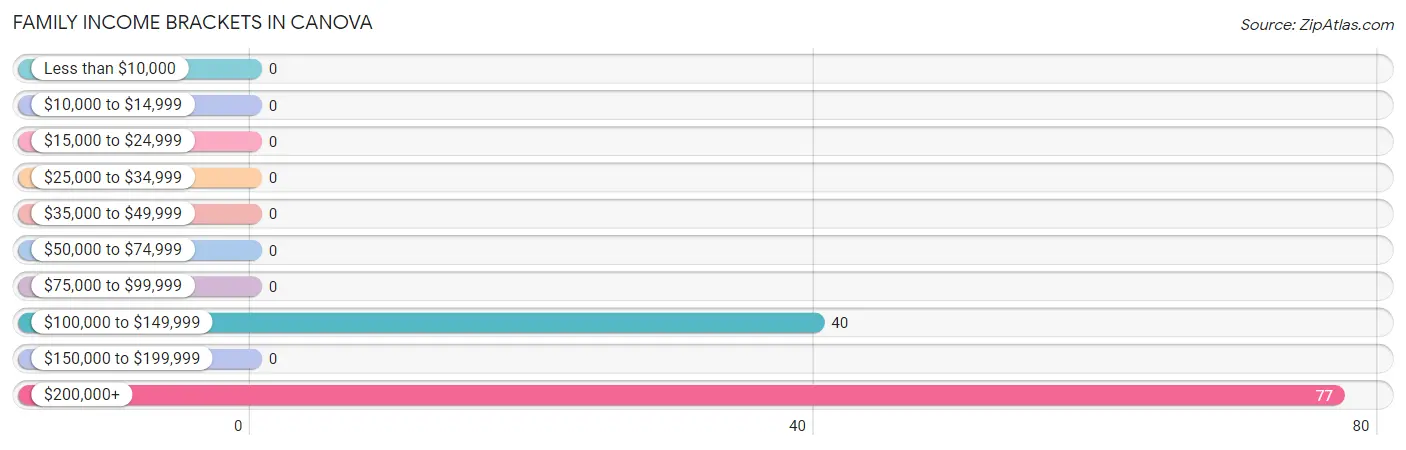
| Income Bracket | # Families | % Families |
| Less than $10,000 | 0 | 0.0% |
| $10,000 to $14,999 | 0 | 0.0% |
| $15,000 to $24,999 | 0 | 0.0% |
| $25,000 to $34,999 | 0 | 0.0% |
| $35,000 to $49,999 | 0 | 0.0% |
| $50,000 to $74,999 | 0 | 0.0% |
| $75,000 to $99,999 | 0 | 0.0% |
| $100,000 to $149,999 | 40 | 34.2% |
| $150,000 to $199,999 | 0 | 0.0% |
| $200,000+ | 77 | 65.8% |
Family Income by Famaliy Size in Canova
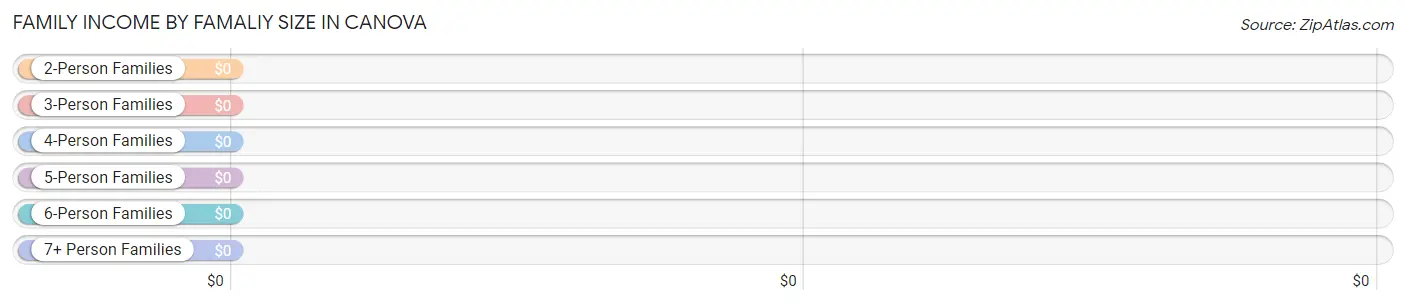
| Income Bracket | # Families | Median Income |
| 2-Person Families | 40 (34.2%) | $0 |
| 3-Person Families | 0 (0.0%) | $0 |
| 4-Person Families | 0 (0.0%) | $0 |
| 5-Person Families | 77 (65.8%) | $0 |
| 6-Person Families | 0 (0.0%) | $0 |
| 7+ Person Families | 0 (0.0%) | $0 |
| Total | 117 (100.0%) | $0 |
Family Income by Number of Earners in Canova
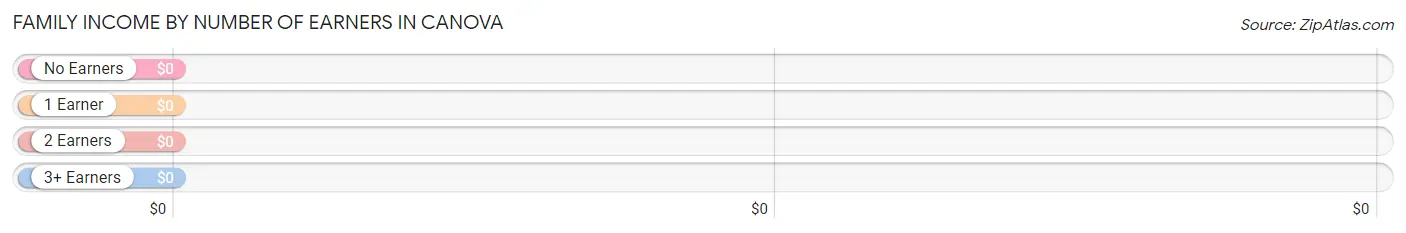
| Number of Earners | # Families | Median Income |
| No Earners | 0 (0.0%) | $0 |
| 1 Earner | 77 (65.8%) | $0 |
| 2 Earners | 40 (34.2%) | $0 |
| 3+ Earners | 0 (0.0%) | $0 |
| Total | 117 (100.0%) | $0 |
Household Income in Canova
Household Income Brackets in Canova
With 91 households falling in the category, the $35,000 to $49,999 income range is the most frequent in Canova, accounting for 43.8% of all households.
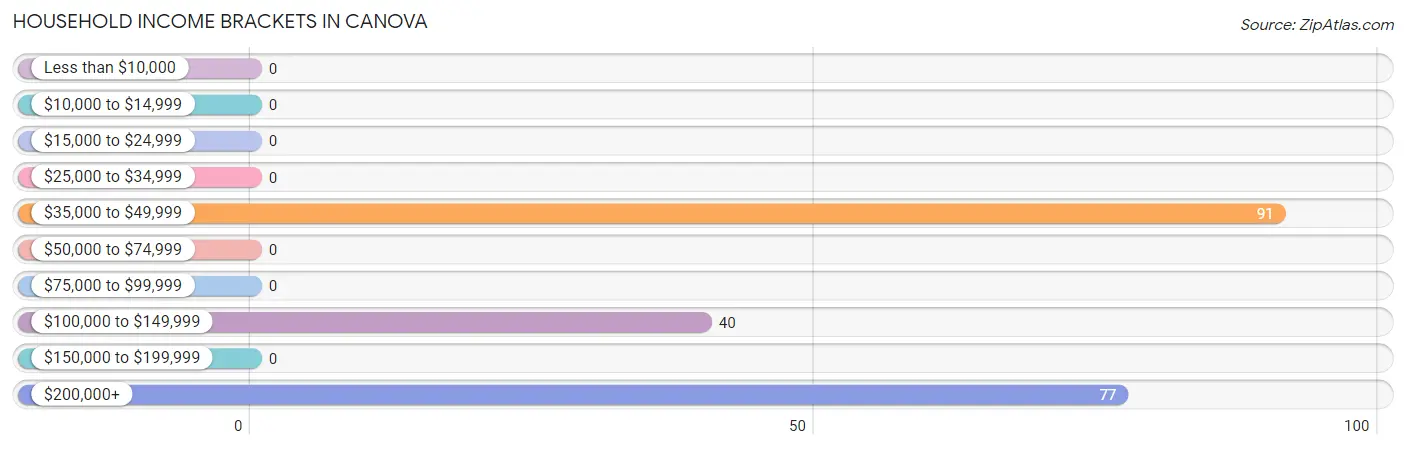
| Income Bracket | # Households | % Households |
| Less than $10,000 | 0 | 0.0% |
| $10,000 to $14,999 | 0 | 0.0% |
| $15,000 to $24,999 | 0 | 0.0% |
| $25,000 to $34,999 | 0 | 0.0% |
| $35,000 to $49,999 | 91 | 43.8% |
| $50,000 to $74,999 | 0 | 0.0% |
| $75,000 to $99,999 | 0 | 0.0% |
| $100,000 to $149,999 | 40 | 19.2% |
| $150,000 to $199,999 | 0 | 0.0% |
| $200,000+ | 77 | 37.0% |
Household Income by Householder Age in Canova

| Income Bracket | # Households | Median Income |
| 15 to 24 Years | 0 (0.0%) | $0 |
| 25 to 44 Years | 0 (0.0%) | $0 |
| 45 to 64 Years | 208 (100.0%) | $0 |
| 65+ Years | 0 (0.0%) | $0 |
| Total | 208 (100.0%) | $0 |
Poverty in Canova
Income Below Poverty by Sex and Age in Canova
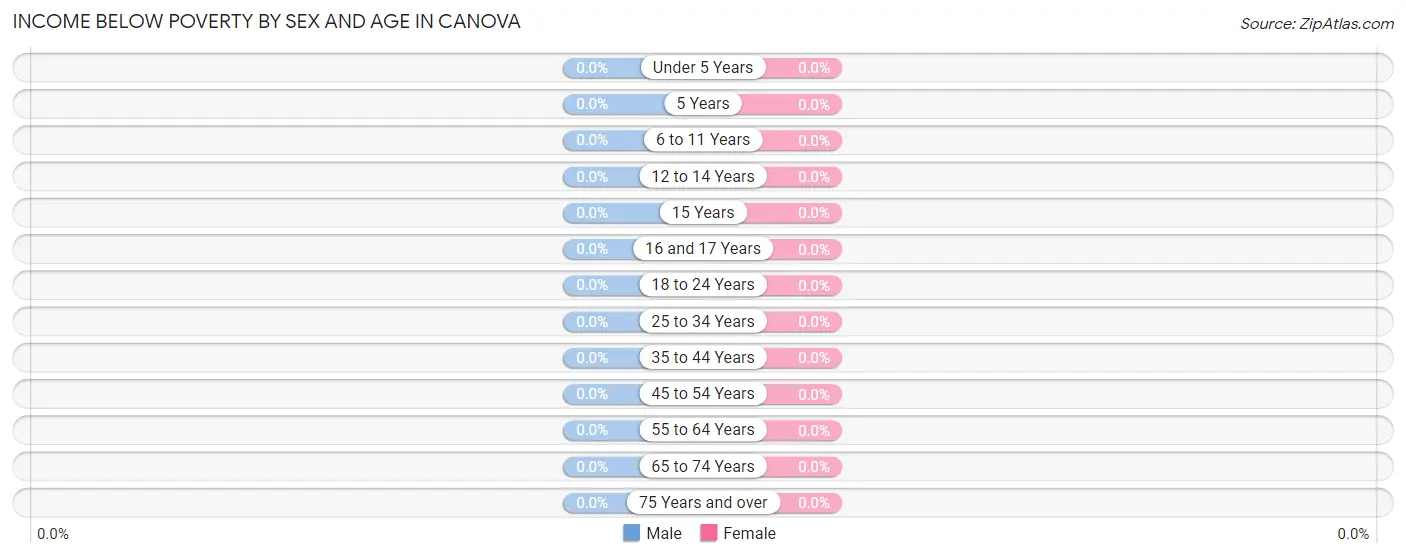
| Age Bracket | Male | Female |
| Under 5 Years | 0 (0.0%) | 0 (0.0%) |
| 5 Years | 0 (0.0%) | 0 (0.0%) |
| 6 to 11 Years | 0 (0.0%) | 0 (0.0%) |
| 12 to 14 Years | 0 (0.0%) | 0 (0.0%) |
| 15 Years | 0 (0.0%) | 0 (0.0%) |
| 16 and 17 Years | 0 (0.0%) | 0 (0.0%) |
| 18 to 24 Years | 0 (0.0%) | 0 (0.0%) |
| 25 to 34 Years | 0 (0.0%) | 0 (0.0%) |
| 35 to 44 Years | 0 (0.0%) | 0 (0.0%) |
| 45 to 54 Years | 0 (0.0%) | 0 (0.0%) |
| 55 to 64 Years | 0 (0.0%) | 0 (0.0%) |
| 65 to 74 Years | 0 (0.0%) | 0 (0.0%) |
| 75 Years and over | 0 (0.0%) | 0 (0.0%) |
| Total | 0 (0.0%) | 0 (0.0%) |
Income Above Poverty by Sex and Age in Canova
According to the poverty statistics in Canova, males aged 25 to 34 years and females aged under 5 years are the age groups that are most secure financially, with 100.0% of males and 100.0% of females in these age groups living above the poverty line.
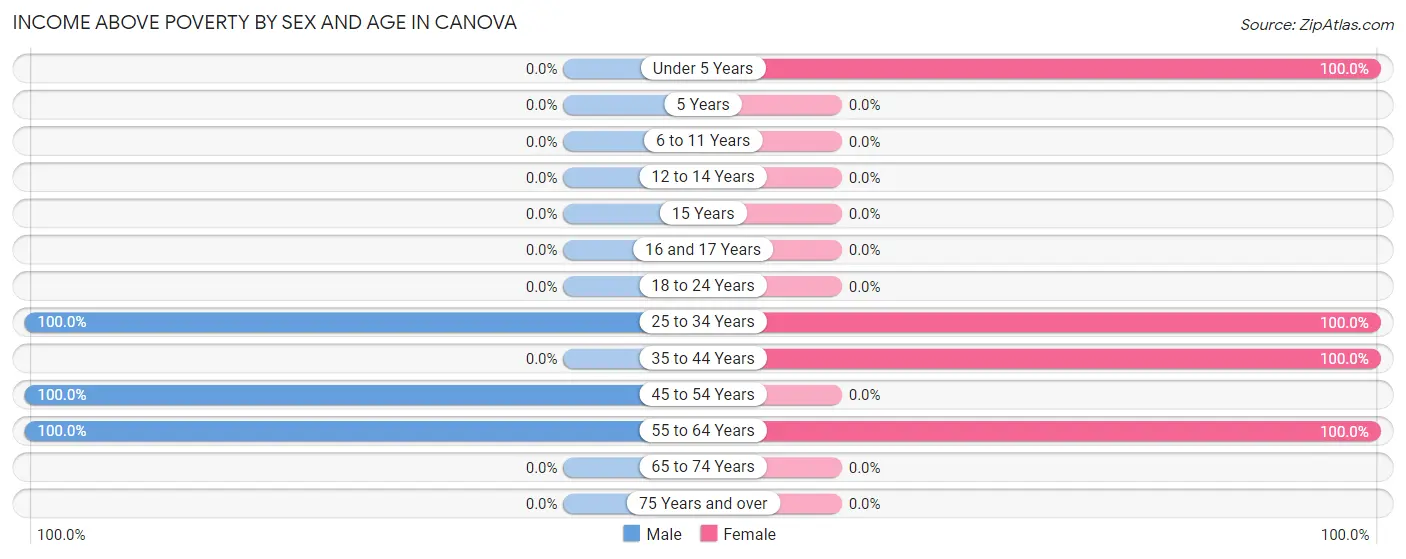
| Age Bracket | Male | Female |
| Under 5 Years | 0 (0.0%) | 80 (100.0%) |
| 5 Years | 0 (0.0%) | 0 (0.0%) |
| 6 to 11 Years | 0 (0.0%) | 0 (0.0%) |
| 12 to 14 Years | 0 (0.0%) | 0 (0.0%) |
| 15 Years | 0 (0.0%) | 0 (0.0%) |
| 16 and 17 Years | 0 (0.0%) | 0 (0.0%) |
| 18 to 24 Years | 0 (0.0%) | 0 (0.0%) |
| 25 to 34 Years | 133 (100.0%) | 102 (100.0%) |
| 35 to 44 Years | 0 (0.0%) | 32 (100.0%) |
| 45 to 54 Years | 131 (100.0%) | 0 (0.0%) |
| 55 to 64 Years | 77 (100.0%) | 34 (100.0%) |
| 65 to 74 Years | 0 (0.0%) | 0 (0.0%) |
| 75 Years and over | 0 (0.0%) | 0 (0.0%) |
| Total | 341 (100.0%) | 248 (100.0%) |
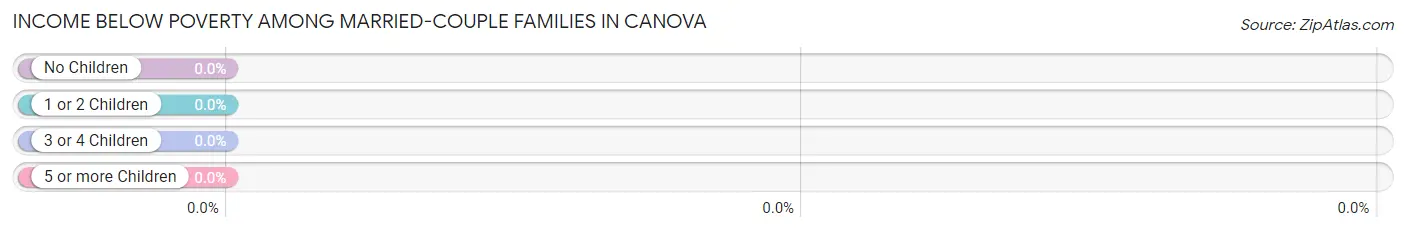
Income Below Poverty Among Married-Couple Families in Canova
| Children | Above Poverty | Below Poverty |
| No Children | 40 (100.0%) | 0 (0.0%) |
| 1 or 2 Children | 77 (100.0%) | 0 (0.0%) |
| 3 or 4 Children | 0 (0.0%) | 0 (0.0%) |
| 5 or more Children | 0 (0.0%) | 0 (0.0%) |
| Total | 117 (100.0%) | 0 (0.0%) |
Income Below Poverty Among Single-Parent Households in Canova
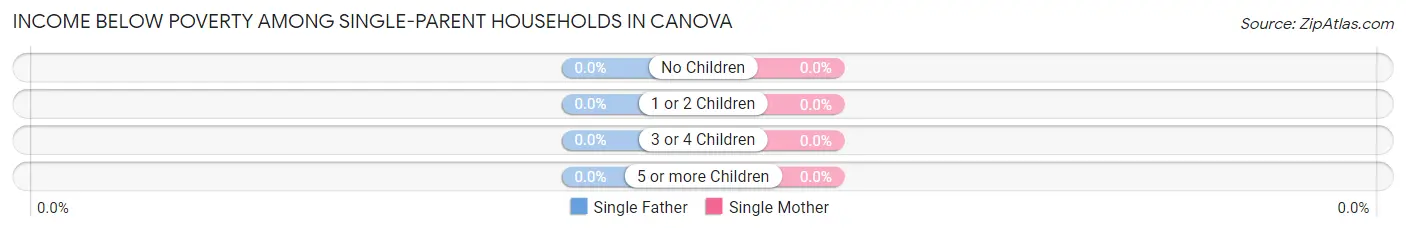
| Children | Single Father | Single Mother |
| No Children | 0 (0.0%) | 0 (0.0%) |
| 1 or 2 Children | 0 (0.0%) | 0 (0.0%) |
| 3 or 4 Children | 0 (0.0%) | 0 (0.0%) |
| 5 or more Children | 0 (0.0%) | 0 (0.0%) |
| Total | 0 (0.0%) | 0 (0.0%) |
Income Below Poverty Among Married-Couple vs Single-Parent Households in Canova

| Children | Married-Couple Families | Single-Parent Households |
| No Children | 0 (0.0%) | 0 (0.0%) |
| 1 or 2 Children | 0 (0.0%) | 0 (0.0%) |
| 3 or 4 Children | 0 (0.0%) | 0 (0.0%) |
| 5 or more Children | 0 (0.0%) | 0 (0.0%) |
| Total | 0 (0.0%) | 0 (0.0%) |
Employment Characteristics in Canova
Employment by Class of Employer in Canova
Among the 296 employed individuals in Canova, private company employees (133 | 44.9%), self-employed (not incorporated) (91 | 30.7%), and self-employed (incorporated) (72 | 24.3%) make up the most common classes of employment.
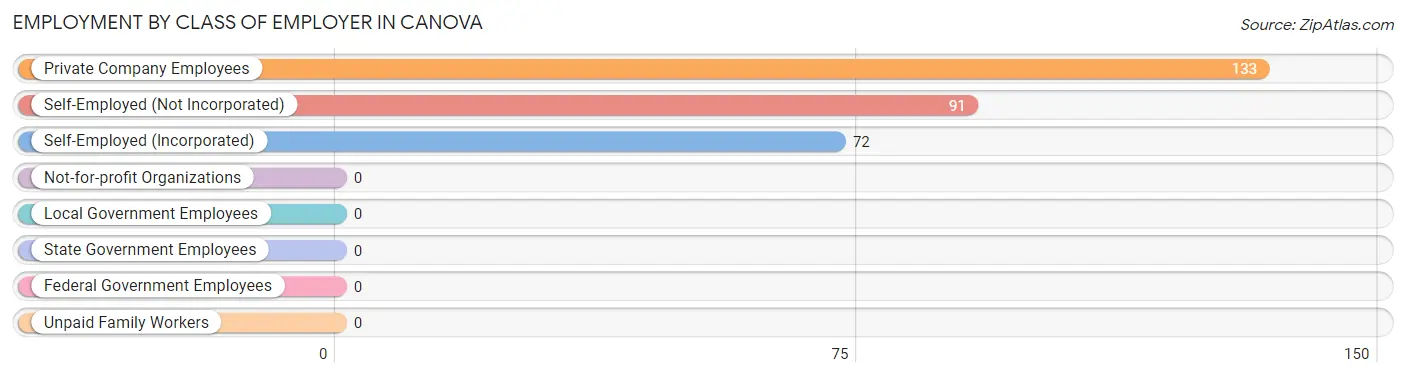
| Employer Class | # Employees | % Employees |
| Private Company Employees | 133 | 44.9% |
| Self-Employed (Incorporated) | 72 | 24.3% |
| Self-Employed (Not Incorporated) | 91 | 30.7% |
| Not-for-profit Organizations | 0 | 0.0% |
| Local Government Employees | 0 | 0.0% |
| State Government Employees | 0 | 0.0% |
| Federal Government Employees | 0 | 0.0% |
| Unpaid Family Workers | 0 | 0.0% |
| Total | 296 | 100.0% |
Employment Status by Age in Canova
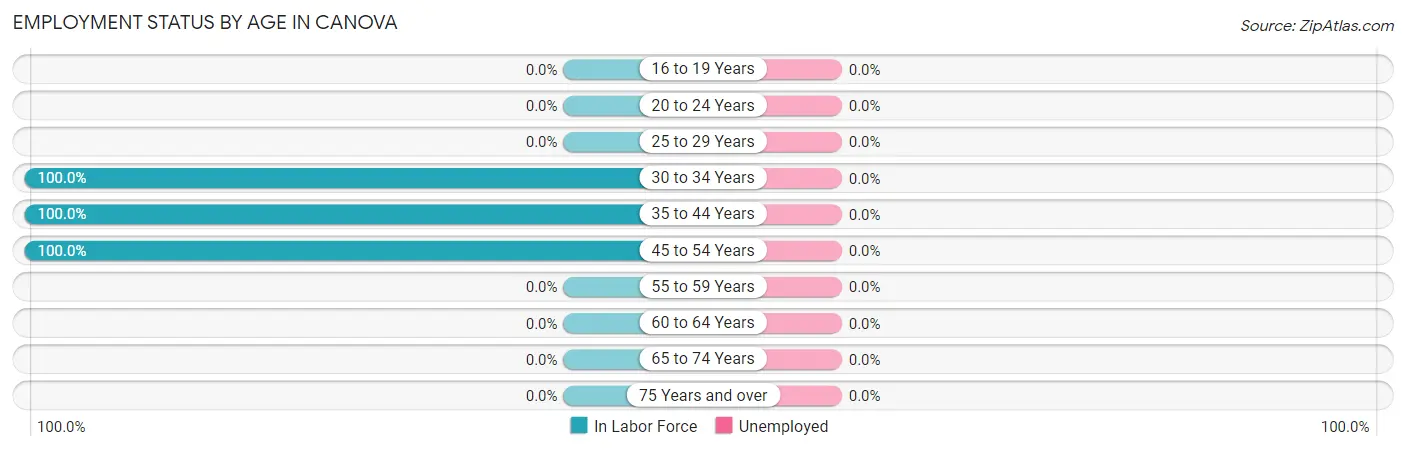
| Age Bracket | In Labor Force | Unemployed |
| 16 to 19 Years | 0 (0.0%) | 0 (0.0%) |
| 20 to 24 Years | 0 (0.0%) | 0 (0.0%) |
| 25 to 29 Years | 0 (0.0%) | 0 (0.0%) |
| 30 to 34 Years | 133 (100.0%) | 0 (0.0%) |
| 35 to 44 Years | 32 (100.0%) | 0 (0.0%) |
| 45 to 54 Years | 131 (100.0%) | 0 (0.0%) |
| 55 to 59 Years | 0 (0.0%) | 0 (0.0%) |
| 60 to 64 Years | 0 (0.0%) | 0 (0.0%) |
| 65 to 74 Years | 0 (0.0%) | 0 (0.0%) |
| 75 Years and over | 0 (0.0%) | 0 (0.0%) |
| Total | 296 (58.2%) | 0 (0.0%) |
Employment Status by Educational Attainment in Canova
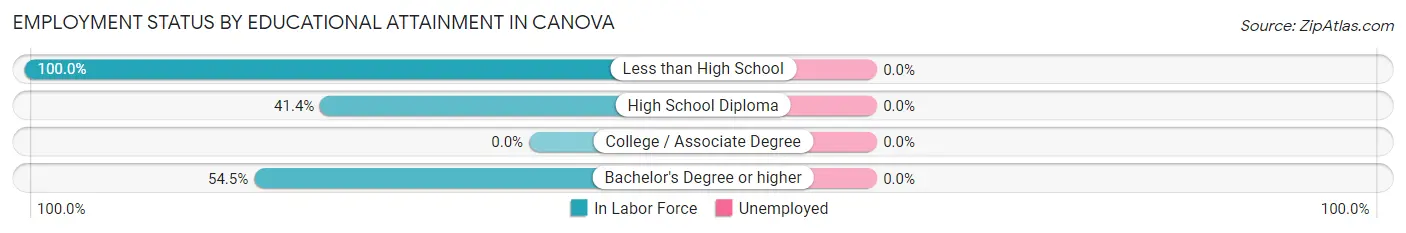
| Educational Attainment | In Labor Force | Unemployed |
| Less than High School | 91 (100.0%) | 0 (0.0%) |
| High School Diploma | 72 (41.4%) | 0 (0.0%) |
| College / Associate Degree | 0 (0.0%) | 0 (0.0%) |
| Bachelor's Degree or higher | 133 (54.5%) | 0 (0.0%) |
| Total | 296 (58.2%) | 0 (0.0%) |
Employment Occupations by Sex in Canova
Management, Business, Science and Arts Occupations
The most common Management, Business, Science and Arts occupations in Canova are Computers, Engineering & Science (133 | 44.9%), and Architecture & Engineering (133 | 44.9%).
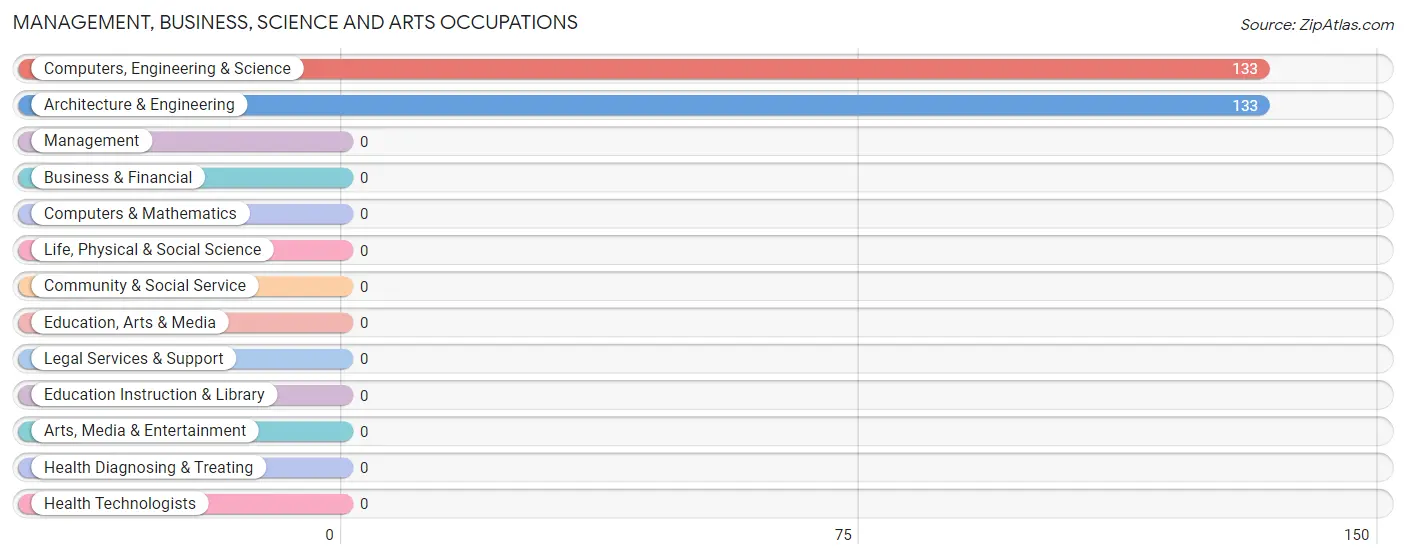
Management, Business, Science and Arts Occupations by Sex
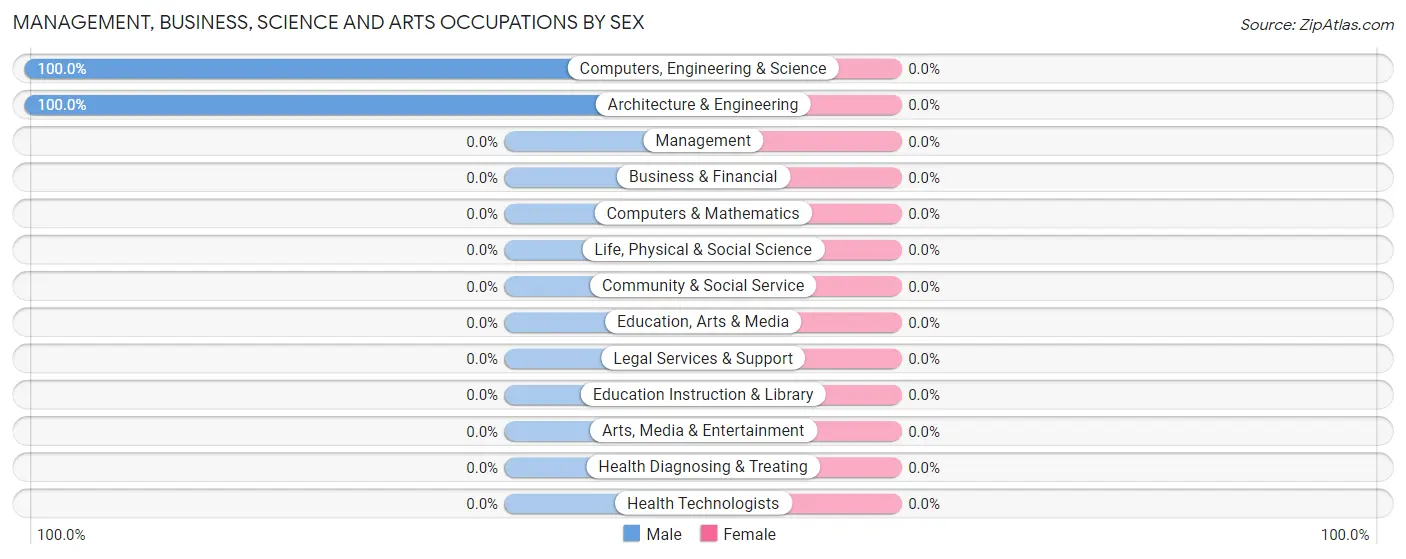
| Occupation | Male | Female |
| Management | 0 (0.0%) | 0 (0.0%) |
| Business & Financial | 0 (0.0%) | 0 (0.0%) |
| Computers, Engineering & Science | 133 (100.0%) | 0 (0.0%) |
| Computers & Mathematics | 0 (0.0%) | 0 (0.0%) |
| Architecture & Engineering | 133 (100.0%) | 0 (0.0%) |
| Life, Physical & Social Science | 0 (0.0%) | 0 (0.0%) |
| Community & Social Service | 0 (0.0%) | 0 (0.0%) |
| Education, Arts & Media | 0 (0.0%) | 0 (0.0%) |
| Legal Services & Support | 0 (0.0%) | 0 (0.0%) |
| Education Instruction & Library | 0 (0.0%) | 0 (0.0%) |
| Arts, Media & Entertainment | 0 (0.0%) | 0 (0.0%) |
| Health Diagnosing & Treating | 0 (0.0%) | 0 (0.0%) |
| Health Technologists | 0 (0.0%) | 0 (0.0%) |
| Total (Category) | 133 (100.0%) | 0 (0.0%) |
| Total (Overall) | 264 (89.2%) | 32 (10.8%) |
Services Occupations
Services Occupations by Sex
| Occupation | Male | Female |
| Healthcare Support | 0 (0.0%) | 0 (0.0%) |
| Security & Protection | 0 (0.0%) | 0 (0.0%) |
| Firefighting & Prevention | 0 (0.0%) | 0 (0.0%) |
| Law Enforcement | 0 (0.0%) | 0 (0.0%) |
| Food Preparation & Serving | 0 (0.0%) | 0 (0.0%) |
| Cleaning & Maintenance | 0 (0.0%) | 0 (0.0%) |
| Personal Care & Service | 0 (0.0%) | 0 (0.0%) |
| Total (Category) | 0 (0.0%) | 0 (0.0%) |
| Total (Overall) | 264 (89.2%) | 32 (10.8%) |
Sales and Office Occupations
The most common Sales and Office occupations in Canova are , and Sales & Related (72 | 24.3%).
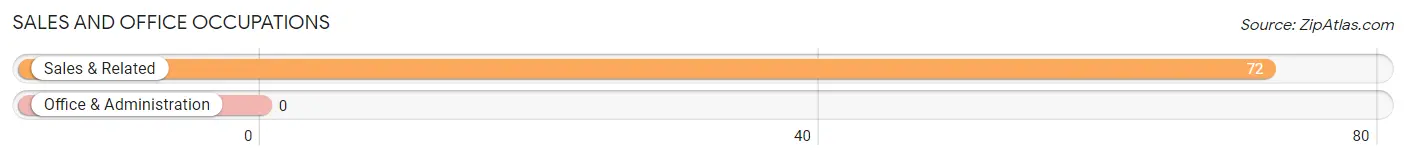
Sales and Office Occupations by Sex
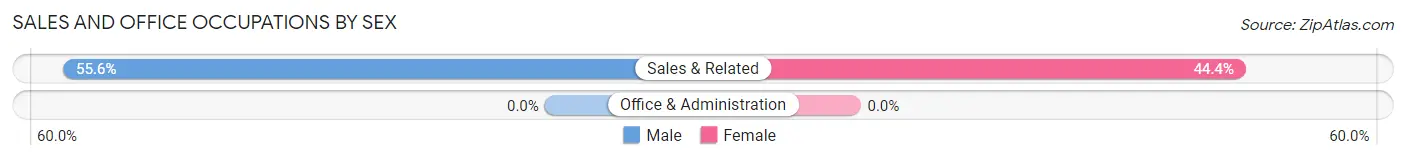
| Occupation | Male | Female |
| Sales & Related | 40 (55.6%) | 32 (44.4%) |
| Office & Administration | 0 (0.0%) | 0 (0.0%) |
| Total (Category) | 40 (55.6%) | 32 (44.4%) |
| Total (Overall) | 264 (89.2%) | 32 (10.8%) |
Natural Resources, Construction and Maintenance Occupations
Natural Resources, Construction and Maintenance Occupations by Sex
| Occupation | Male | Female |
| Farming, Fishing & Forestry | 0 (0.0%) | 0 (0.0%) |
| Construction & Extraction | 0 (0.0%) | 0 (0.0%) |
| Installation, Maintenance & Repair | 0 (0.0%) | 0 (0.0%) |
| Total (Category) | 0 (0.0%) | 0 (0.0%) |
| Total (Overall) | 264 (89.2%) | 32 (10.8%) |
Production, Transportation and Moving Occupations
The most common Production, Transportation and Moving occupations in Canova are , and Transportation (91 | 30.7%).
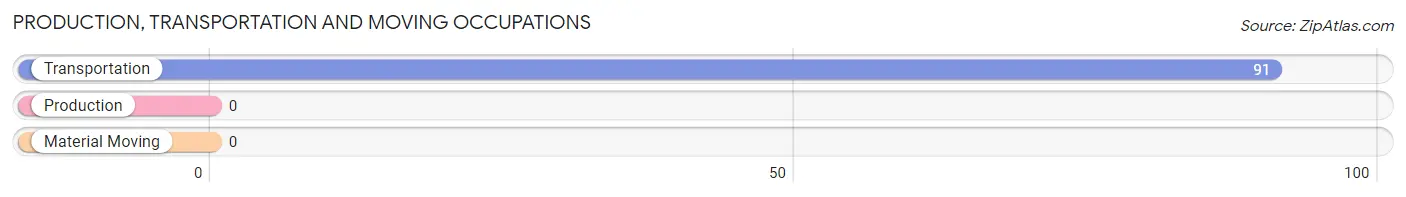
Production, Transportation and Moving Occupations by Sex
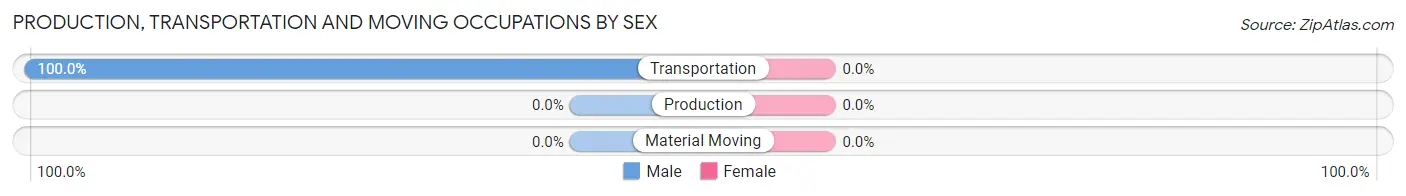
| Occupation | Male | Female |
| Production | 0 (0.0%) | 0 (0.0%) |
| Transportation | 91 (100.0%) | 0 (0.0%) |
| Material Moving | 0 (0.0%) | 0 (0.0%) |
| Total (Category) | 91 (100.0%) | 0 (0.0%) |
| Total (Overall) | 264 (89.2%) | 32 (10.8%) |
Employment Industries by Sex in Canova
Employment Industries in Canova
The major employment industries in Canova include Administrative & Support (133 | 44.9%), and Transportation & Warehousing (91 | 30.7%).

Employment Industries by Sex in Canova
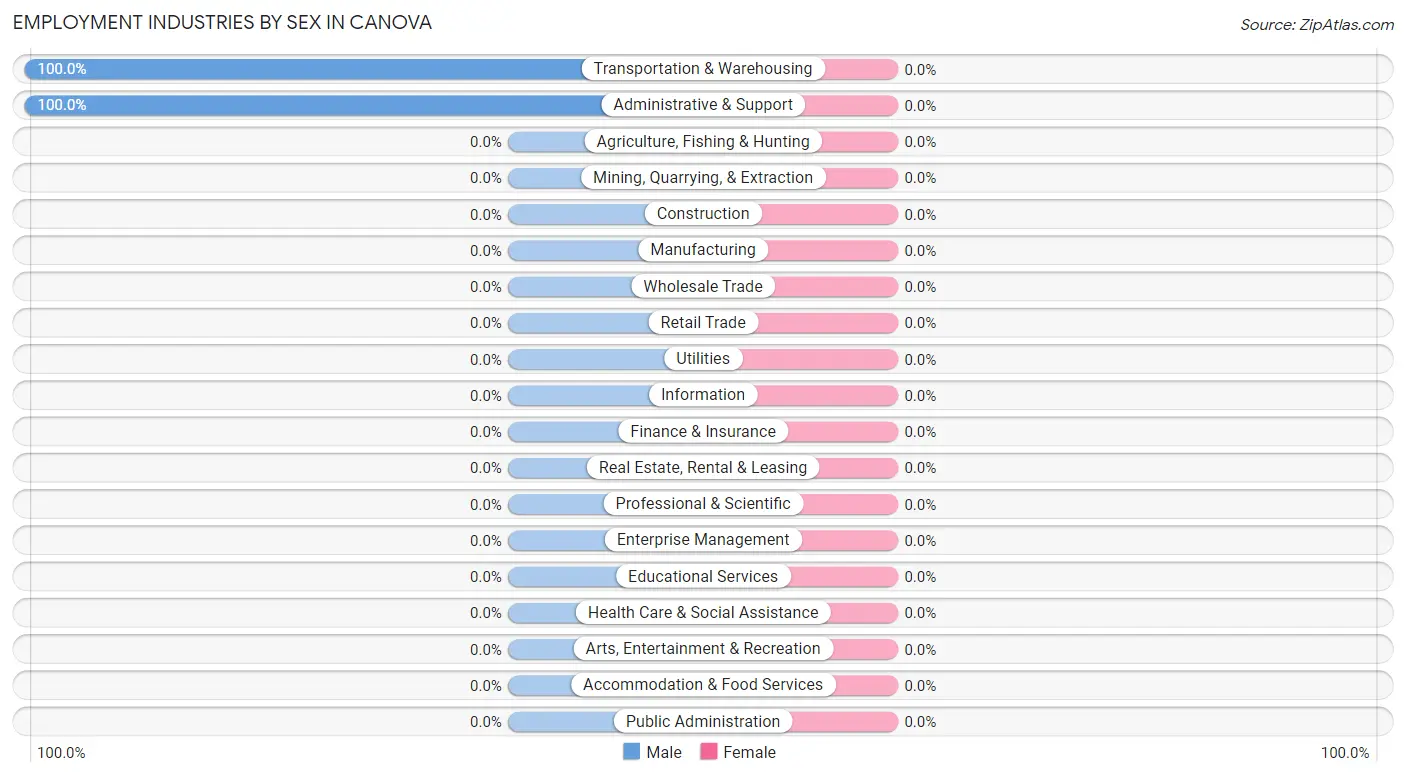
| Industry | Male | Female |
| Agriculture, Fishing & Hunting | 0 (0.0%) | 0 (0.0%) |
| Mining, Quarrying, & Extraction | 0 (0.0%) | 0 (0.0%) |
| Construction | 0 (0.0%) | 0 (0.0%) |
| Manufacturing | 0 (0.0%) | 0 (0.0%) |
| Wholesale Trade | 0 (0.0%) | 0 (0.0%) |
| Retail Trade | 0 (0.0%) | 0 (0.0%) |
| Transportation & Warehousing | 91 (100.0%) | 0 (0.0%) |
| Utilities | 0 (0.0%) | 0 (0.0%) |
| Information | 0 (0.0%) | 0 (0.0%) |
| Finance & Insurance | 0 (0.0%) | 0 (0.0%) |
| Real Estate, Rental & Leasing | 0 (0.0%) | 0 (0.0%) |
| Professional & Scientific | 0 (0.0%) | 0 (0.0%) |
| Enterprise Management | 0 (0.0%) | 0 (0.0%) |
| Administrative & Support | 133 (100.0%) | 0 (0.0%) |
| Educational Services | 0 (0.0%) | 0 (0.0%) |
| Health Care & Social Assistance | 0 (0.0%) | 0 (0.0%) |
| Arts, Entertainment & Recreation | 0 (0.0%) | 0 (0.0%) |
| Accommodation & Food Services | 0 (0.0%) | 0 (0.0%) |
| Public Administration | 0 (0.0%) | 0 (0.0%) |
| Total | 264 (89.2%) | 32 (10.8%) |
Education in Canova
School Enrollment in Canova
| School Level | # Students | % Students |
| Nursery / Preschool | 0 | 0.0% |
| Kindergarten | 0 | 0.0% |
| Elementary School | 0 | 0.0% |
| Middle School | 0 | 0.0% |
| High School | 0 | 0.0% |
| College / Undergraduate | 0 | 0.0% |
| Graduate / Professional | 0 | 0.0% |
| Total | 0 | 0.0% |
School Enrollment by Age by Funding Source in Canova
| Age Bracket | Public School | Private School |
| 3 to 4 Year Olds | 0 (0.0%) | 0 (0.0%) |
| 5 to 9 Year Old | 0 (0.0%) | 0 (0.0%) |
| 10 to 14 Year Olds | 0 (0.0%) | 0 (0.0%) |
| 15 to 17 Year Olds | 0 (0.0%) | 0 (0.0%) |
| 18 to 19 Year Olds | 0 (0.0%) | 0 (0.0%) |
| 20 to 24 Year Olds | 0 (0.0%) | 0 (0.0%) |
| 25 to 34 Year Olds | 0 (0.0%) | 0 (0.0%) |
| 35 Years and over | 0 (0.0%) | 0 (0.0%) |
| Total | 0 (0.0%) | 0 (0.0%) |
Educational Attainment by Field of Study in Canova
Engineering (210 | 86.1%), and business (34 | 13.9%) are the most common fields of study among 244 individuals in Canova who have obtained a bachelor's degree or higher.
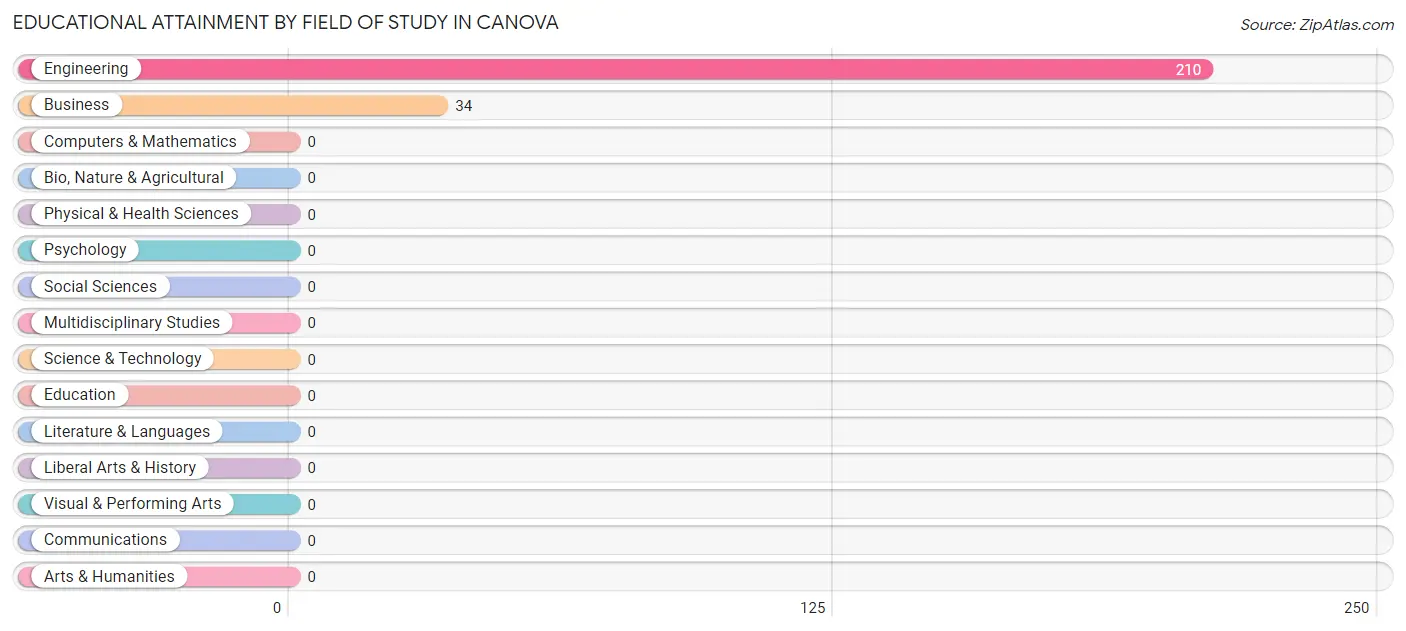
| Field of Study | # Graduates | % Graduates |
| Computers & Mathematics | 0 | 0.0% |
| Bio, Nature & Agricultural | 0 | 0.0% |
| Physical & Health Sciences | 0 | 0.0% |
| Psychology | 0 | 0.0% |
| Social Sciences | 0 | 0.0% |
| Engineering | 210 | 86.1% |
| Multidisciplinary Studies | 0 | 0.0% |
| Science & Technology | 0 | 0.0% |
| Business | 34 | 13.9% |
| Education | 0 | 0.0% |
| Literature & Languages | 0 | 0.0% |
| Liberal Arts & History | 0 | 0.0% |
| Visual & Performing Arts | 0 | 0.0% |
| Communications | 0 | 0.0% |
| Arts & Humanities | 0 | 0.0% |
| Total | 244 | 100.0% |
Transportation & Commute in Canova
Vehicle Availability by Sex in Canova
The most prevalent vehicle ownership categories in Canova are males with 5 or more vehicles (173, accounting for 65.5%) and females with 5 or more vehicles (32, making up 540.6%).
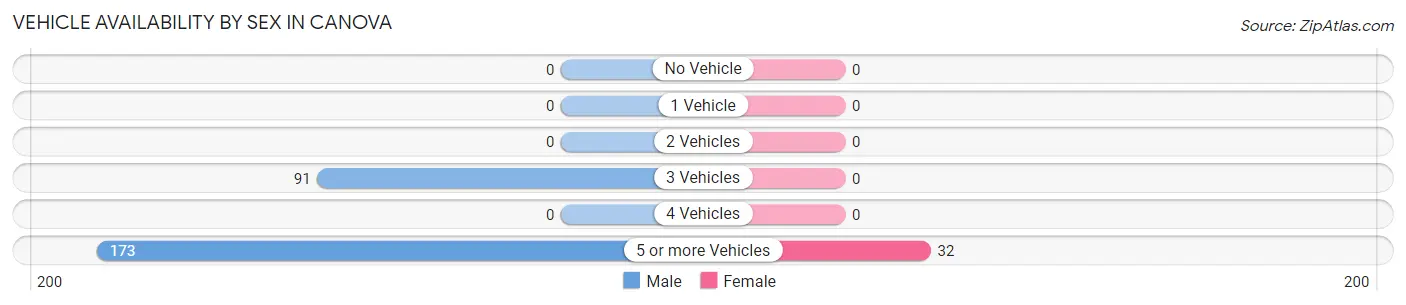
| Vehicles Available | Male | Female |
| No Vehicle | 0 (0.0%) | 0 (0.0%) |
| 1 Vehicle | 0 (0.0%) | 0 (0.0%) |
| 2 Vehicles | 0 (0.0%) | 0 (0.0%) |
| 3 Vehicles | 91 (34.5%) | 0 (0.0%) |
| 4 Vehicles | 0 (0.0%) | 0 (0.0%) |
| 5 or more Vehicles | 173 (65.5%) | 32 (100.0%) |
| Total | 264 (100.0%) | 32 (100.0%) |
Commute Time in Canova
The most frequently occuring commute durations in Canova are 60 to 89 minutes (165 commuters, 55.7%), 5 to 9 minutes (91 commuters, 30.7%), and 30 to 34 minutes (40 commuters, 13.5%).
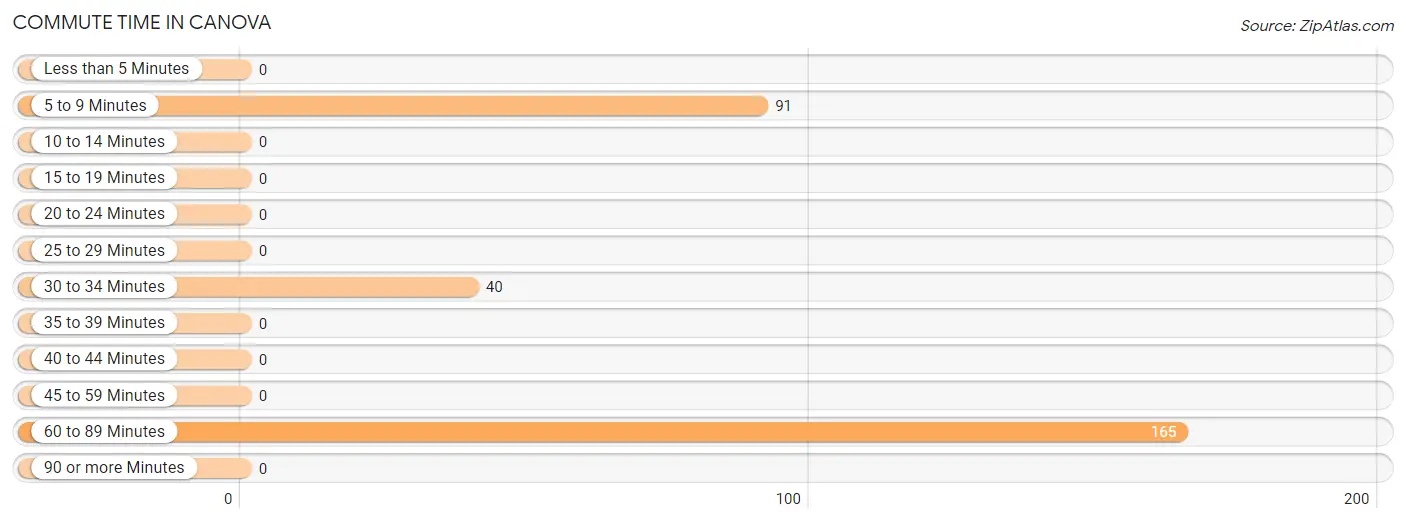
| Commute Time | # Commuters | % Commuters |
| Less than 5 Minutes | 0 | 0.0% |
| 5 to 9 Minutes | 91 | 30.7% |
| 10 to 14 Minutes | 0 | 0.0% |
| 15 to 19 Minutes | 0 | 0.0% |
| 20 to 24 Minutes | 0 | 0.0% |
| 25 to 29 Minutes | 0 | 0.0% |
| 30 to 34 Minutes | 40 | 13.5% |
| 35 to 39 Minutes | 0 | 0.0% |
| 40 to 44 Minutes | 0 | 0.0% |
| 45 to 59 Minutes | 0 | 0.0% |
| 60 to 89 Minutes | 165 | 55.7% |
| 90 or more Minutes | 0 | 0.0% |
Commute Time by Sex in Canova
The most common commute times in Canova are 60 to 89 minutes (133 commuters, 50.4%) for males and 60 to 89 minutes (32 commuters, 100.0%) for females.
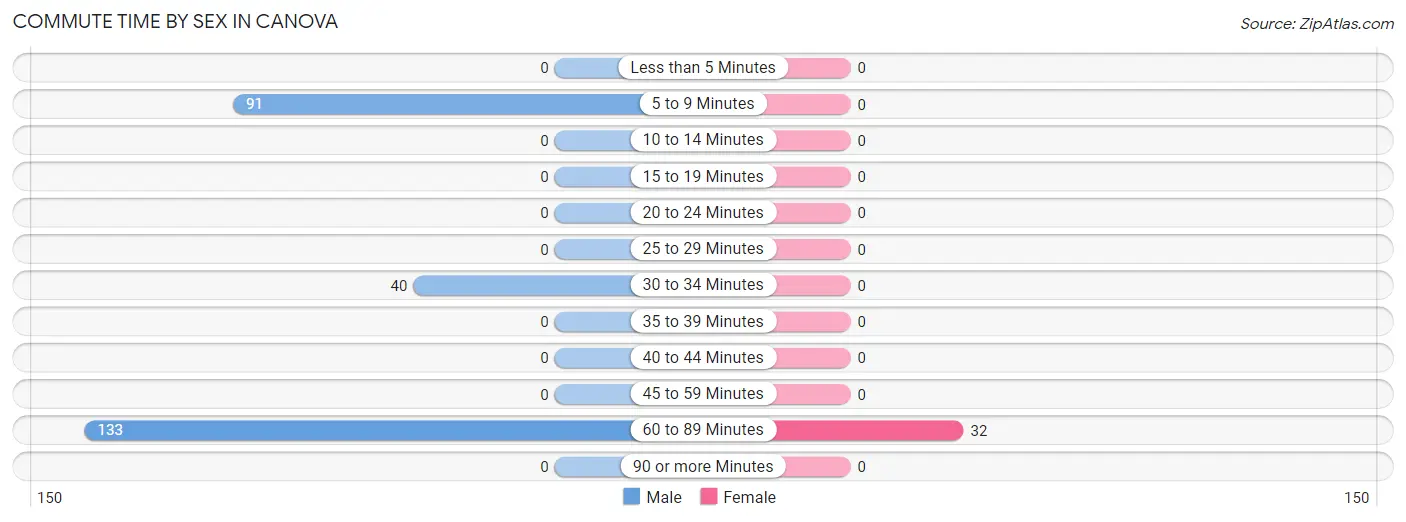
| Commute Time | Male | Female |
| Less than 5 Minutes | 0 (0.0%) | 0 (0.0%) |
| 5 to 9 Minutes | 91 (34.5%) | 0 (0.0%) |
| 10 to 14 Minutes | 0 (0.0%) | 0 (0.0%) |
| 15 to 19 Minutes | 0 (0.0%) | 0 (0.0%) |
| 20 to 24 Minutes | 0 (0.0%) | 0 (0.0%) |
| 25 to 29 Minutes | 0 (0.0%) | 0 (0.0%) |
| 30 to 34 Minutes | 40 (15.1%) | 0 (0.0%) |
| 35 to 39 Minutes | 0 (0.0%) | 0 (0.0%) |
| 40 to 44 Minutes | 0 (0.0%) | 0 (0.0%) |
| 45 to 59 Minutes | 0 (0.0%) | 0 (0.0%) |
| 60 to 89 Minutes | 133 (50.4%) | 32 (100.0%) |
| 90 or more Minutes | 0 (0.0%) | 0 (0.0%) |
Time of Departure to Work by Sex in Canova
The most frequent times of departure to work in Canova are 6:30 AM to 6:59 AM (133, 50.4%) for males and 8:00 AM to 8:29 AM (32, 100.0%) for females.
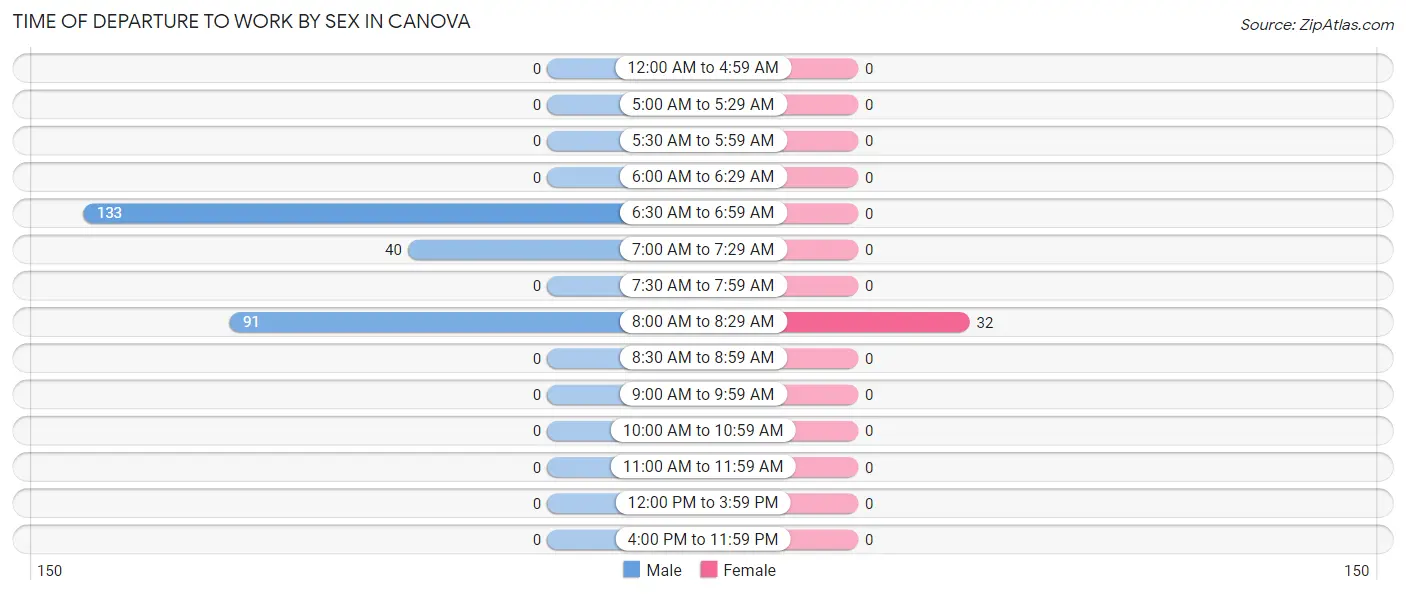
| Time of Departure | Male | Female |
| 12:00 AM to 4:59 AM | 0 (0.0%) | 0 (0.0%) |
| 5:00 AM to 5:29 AM | 0 (0.0%) | 0 (0.0%) |
| 5:30 AM to 5:59 AM | 0 (0.0%) | 0 (0.0%) |
| 6:00 AM to 6:29 AM | 0 (0.0%) | 0 (0.0%) |
| 6:30 AM to 6:59 AM | 133 (50.4%) | 0 (0.0%) |
| 7:00 AM to 7:29 AM | 40 (15.1%) | 0 (0.0%) |
| 7:30 AM to 7:59 AM | 0 (0.0%) | 0 (0.0%) |
| 8:00 AM to 8:29 AM | 91 (34.5%) | 32 (100.0%) |
| 8:30 AM to 8:59 AM | 0 (0.0%) | 0 (0.0%) |
| 9:00 AM to 9:59 AM | 0 (0.0%) | 0 (0.0%) |
| 10:00 AM to 10:59 AM | 0 (0.0%) | 0 (0.0%) |
| 11:00 AM to 11:59 AM | 0 (0.0%) | 0 (0.0%) |
| 12:00 PM to 3:59 PM | 0 (0.0%) | 0 (0.0%) |
| 4:00 PM to 11:59 PM | 0 (0.0%) | 0 (0.0%) |
| Total | 264 (100.0%) | 32 (100.0%) |
Housing Occupancy in Canova
Occupancy by Ownership in Canova
Of the total 208 dwellings in Canova, owner-occupied units account for 208 (100.0%), while renter-occupied units make up 0 (0.0%).
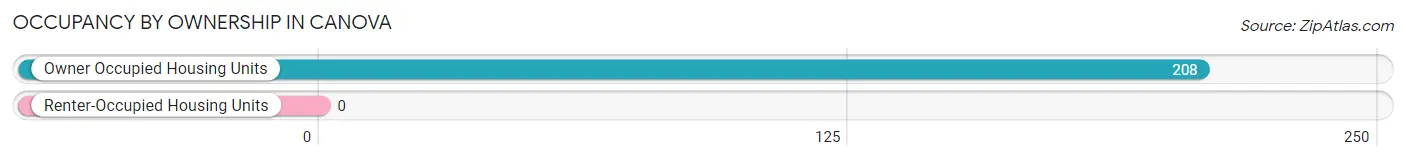
| Occupancy | # Housing Units | % Housing Units |
| Owner Occupied Housing Units | 208 | 100.0% |
| Renter-Occupied Housing Units | 0 | 0.0% |
| Total Occupied Housing Units | 208 | 100.0% |
Occupancy by Household Size in Canova
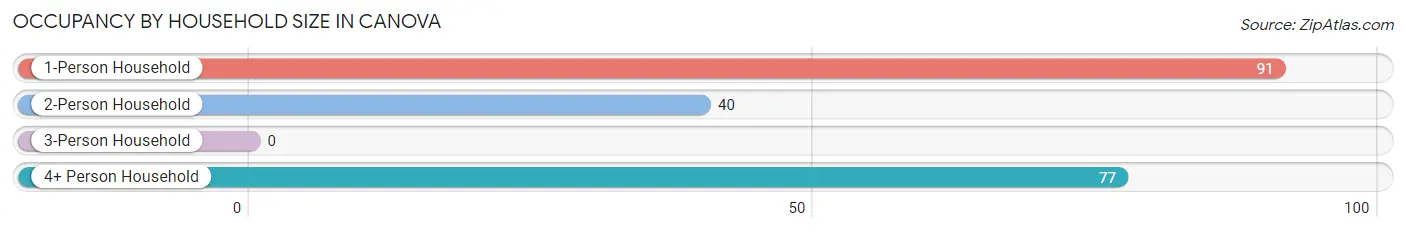
| Household Size | # Housing Units | % Housing Units |
| 1-Person Household | 91 | 43.8% |
| 2-Person Household | 40 | 19.2% |
| 3-Person Household | 0 | 0.0% |
| 4+ Person Household | 77 | 37.0% |
| Total Housing Units | 208 | 100.0% |
Occupancy by Ownership by Household Size in Canova
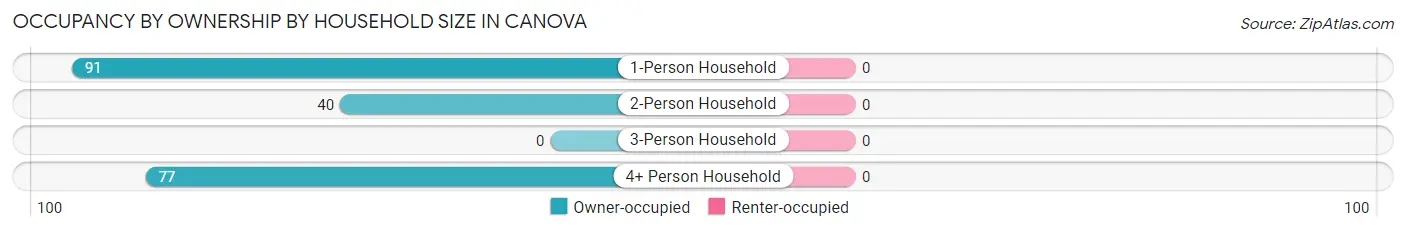
| Household Size | Owner-occupied | Renter-occupied |
| 1-Person Household | 91 (100.0%) | 0 (0.0%) |
| 2-Person Household | 40 (100.0%) | 0 (0.0%) |
| 3-Person Household | 0 (0.0%) | 0 (0.0%) |
| 4+ Person Household | 77 (100.0%) | 0 (0.0%) |
| Total Housing Units | 208 (100.0%) | 0 (0.0%) |
Occupancy by Educational Attainment in Canova
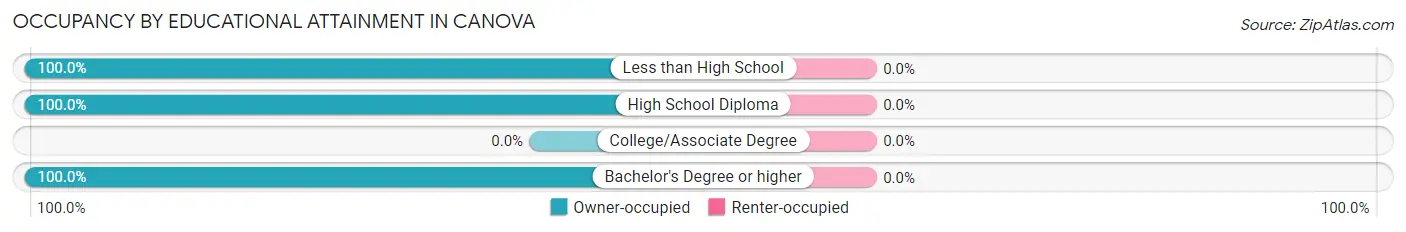
| Household Size | Owner-occupied | Renter-occupied |
| Less than High School | 91 (100.0%) | 0 (0.0%) |
| High School Diploma | 40 (100.0%) | 0 (0.0%) |
| College/Associate Degree | 0 (0.0%) | 0 (0.0%) |
| Bachelor's Degree or higher | 77 (100.0%) | 0 (0.0%) |
Occupancy by Age of Householder in Canova
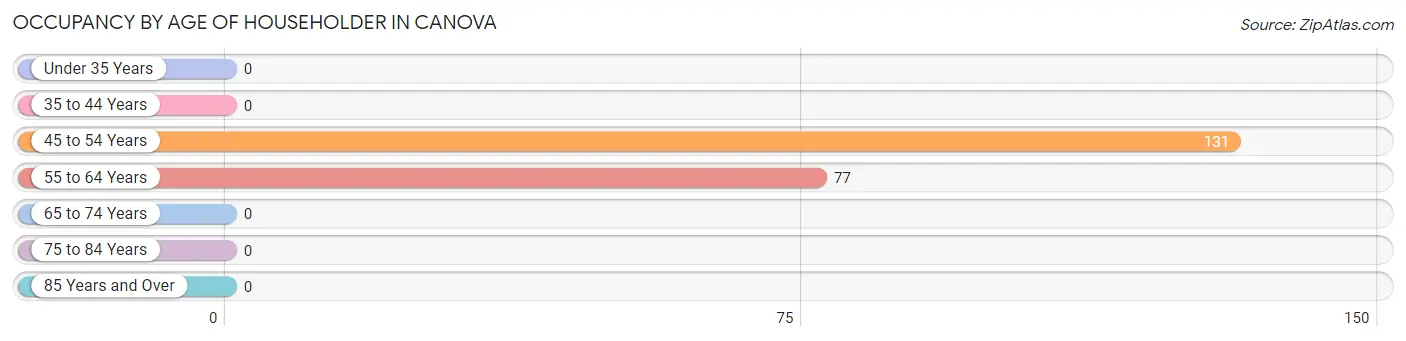
| Age Bracket | # Households | % Households |
| Under 35 Years | 0 | 0.0% |
| 35 to 44 Years | 0 | 0.0% |
| 45 to 54 Years | 131 | 63.0% |
| 55 to 64 Years | 77 | 37.0% |
| 65 to 74 Years | 0 | 0.0% |
| 75 to 84 Years | 0 | 0.0% |
| 85 Years and Over | 0 | 0.0% |
| Total | 208 | 100.0% |
Housing Finances in Canova
Median Income by Occupancy in Canova
| Occupancy Type | # Households | Median Income |
| Owner-Occupied | 208 (100.0%) | $0 |
| Renter-Occupied | 0 (0.0%) | $0 |
| Average | 208 (100.0%) | $0 |
Occupancy by Householder Income Bracket in Canova
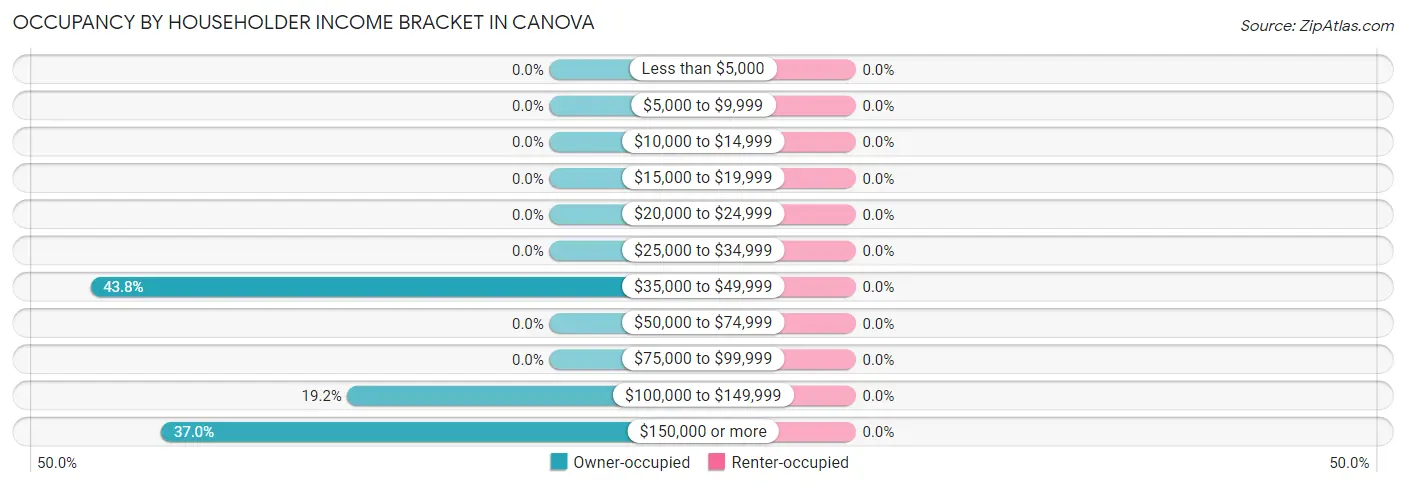
| Income Bracket | Owner-occupied | Renter-occupied |
| Less than $5,000 | 0 (0.0%) | 0 (0.0%) |
| $5,000 to $9,999 | 0 (0.0%) | 0 (0.0%) |
| $10,000 to $14,999 | 0 (0.0%) | 0 (0.0%) |
| $15,000 to $19,999 | 0 (0.0%) | 0 (0.0%) |
| $20,000 to $24,999 | 0 (0.0%) | 0 (0.0%) |
| $25,000 to $34,999 | 0 (0.0%) | 0 (0.0%) |
| $35,000 to $49,999 | 91 (43.8%) | 0 (0.0%) |
| $50,000 to $74,999 | 0 (0.0%) | 0 (0.0%) |
| $75,000 to $99,999 | 0 (0.0%) | 0 (0.0%) |
| $100,000 to $149,999 | 40 (19.2%) | 0 (0.0%) |
| $150,000 or more | 77 (37.0%) | 0 (0.0%) |
| Total | 208 (100.0%) | 0 (0.0%) |
Monthly Housing Cost Tiers in Canova
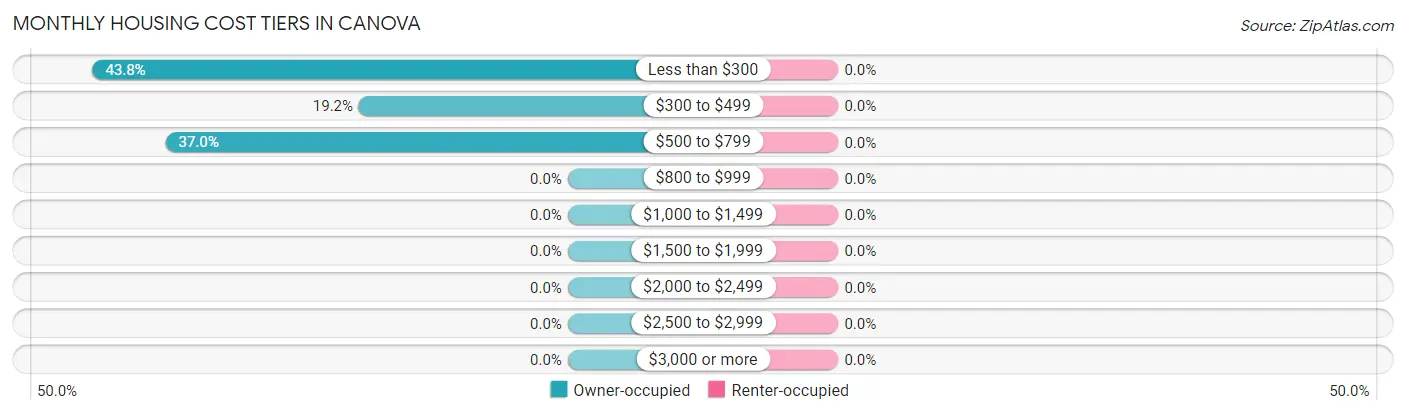
| Monthly Cost | Owner-occupied | Renter-occupied |
| Less than $300 | 91 (43.8%) | 0 (0.0%) |
| $300 to $499 | 40 (19.2%) | 0 (0.0%) |
| $500 to $799 | 77 (37.0%) | 0 (0.0%) |
| $800 to $999 | 0 (0.0%) | 0 (0.0%) |
| $1,000 to $1,499 | 0 (0.0%) | 0 (0.0%) |
| $1,500 to $1,999 | 0 (0.0%) | 0 (0.0%) |
| $2,000 to $2,499 | 0 (0.0%) | 0 (0.0%) |
| $2,500 to $2,999 | 0 (0.0%) | 0 (0.0%) |
| $3,000 or more | 0 (0.0%) | 0 (0.0%) |
| Total | 208 (100.0%) | 0 (0.0%) |
Physical Housing Characteristics in Canova
Housing Structures in Canova
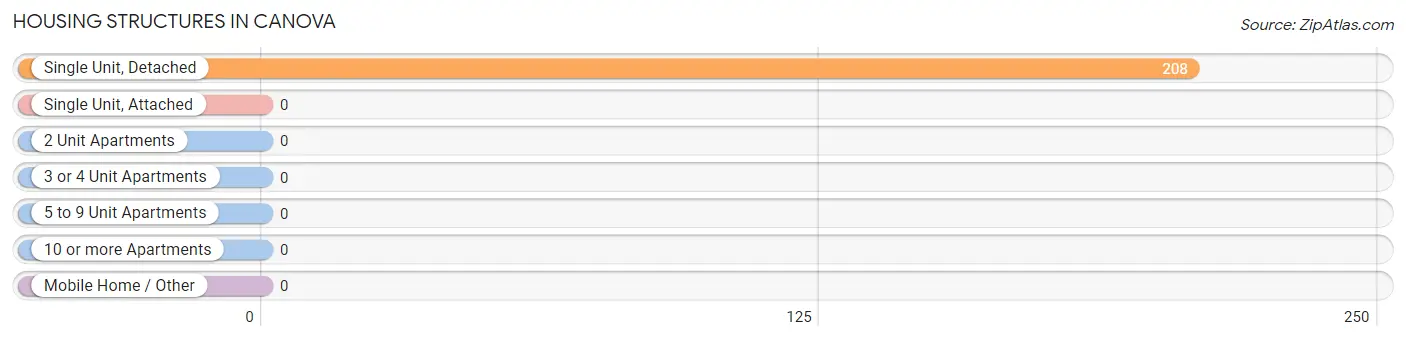
| Structure Type | # Housing Units | % Housing Units |
| Single Unit, Detached | 208 | 100.0% |
| Single Unit, Attached | 0 | 0.0% |
| 2 Unit Apartments | 0 | 0.0% |
| 3 or 4 Unit Apartments | 0 | 0.0% |
| 5 to 9 Unit Apartments | 0 | 0.0% |
| 10 or more Apartments | 0 | 0.0% |
| Mobile Home / Other | 0 | 0.0% |
| Total | 208 | 100.0% |
Housing Structures by Occupancy in Canova
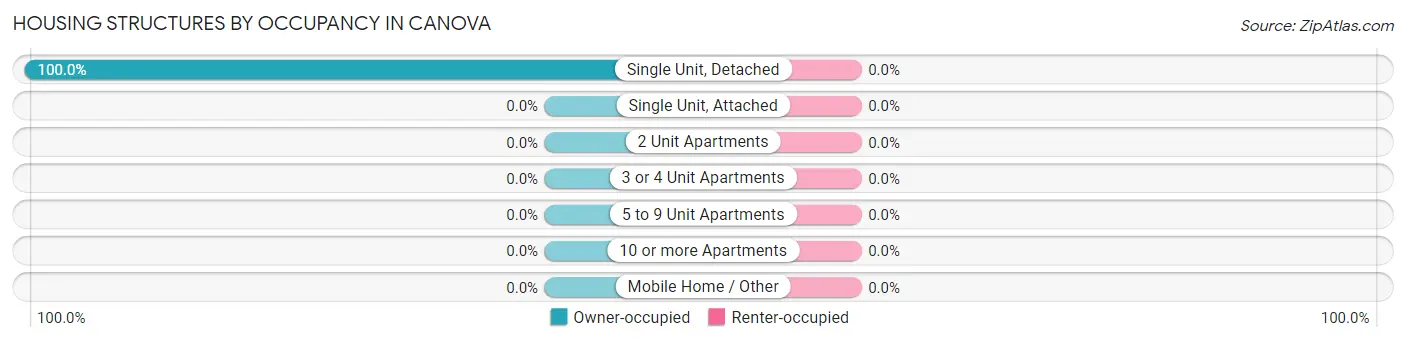
| Structure Type | Owner-occupied | Renter-occupied |
| Single Unit, Detached | 208 (100.0%) | 0 (0.0%) |
| Single Unit, Attached | 0 (0.0%) | 0 (0.0%) |
| 2 Unit Apartments | 0 (0.0%) | 0 (0.0%) |
| 3 or 4 Unit Apartments | 0 (0.0%) | 0 (0.0%) |
| 5 to 9 Unit Apartments | 0 (0.0%) | 0 (0.0%) |
| 10 or more Apartments | 0 (0.0%) | 0 (0.0%) |
| Mobile Home / Other | 0 (0.0%) | 0 (0.0%) |
| Total | 208 (100.0%) | 0 (0.0%) |
Housing Structures by Number of Rooms in Canova
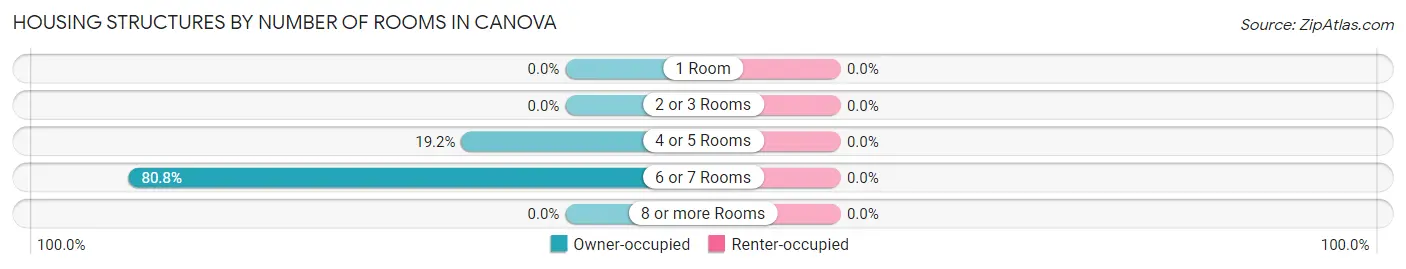
| Number of Rooms | Owner-occupied | Renter-occupied |
| 1 Room | 0 (0.0%) | 0 (0.0%) |
| 2 or 3 Rooms | 0 (0.0%) | 0 (0.0%) |
| 4 or 5 Rooms | 40 (19.2%) | 0 (0.0%) |
| 6 or 7 Rooms | 168 (80.8%) | 0 (0.0%) |
| 8 or more Rooms | 0 (0.0%) | 0 (0.0%) |
| Total | 208 (100.0%) | 0 (0.0%) |
Housing Structure by Heating Type in Canova
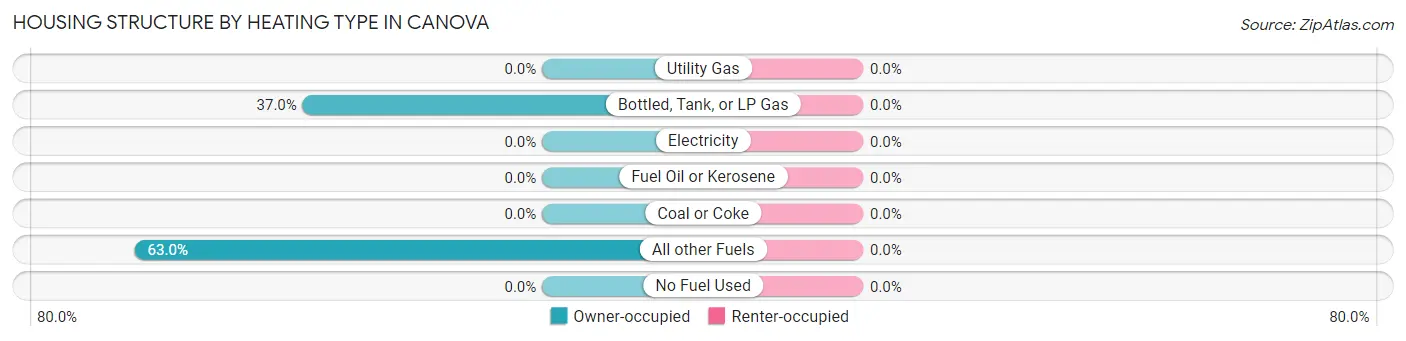
| Heating Type | Owner-occupied | Renter-occupied |
| Utility Gas | 0 (0.0%) | 0 (0.0%) |
| Bottled, Tank, or LP Gas | 77 (37.0%) | 0 (0.0%) |
| Electricity | 0 (0.0%) | 0 (0.0%) |
| Fuel Oil or Kerosene | 0 (0.0%) | 0 (0.0%) |
| Coal or Coke | 0 (0.0%) | 0 (0.0%) |
| All other Fuels | 131 (63.0%) | 0 (0.0%) |
| No Fuel Used | 0 (0.0%) | 0 (0.0%) |
| Total | 208 (100.0%) | 0 (0.0%) |
Household Vehicle Usage in Canova
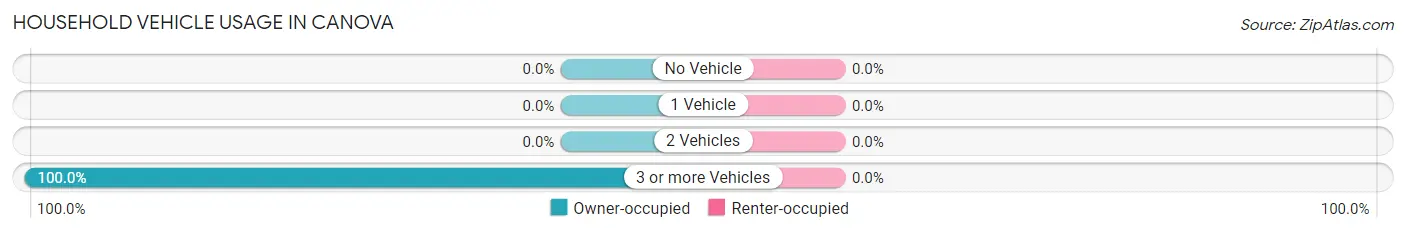
| Vehicles per Household | Owner-occupied | Renter-occupied |
| No Vehicle | 0 (0.0%) | 0 (0.0%) |
| 1 Vehicle | 0 (0.0%) | 0 (0.0%) |
| 2 Vehicles | 0 (0.0%) | 0 (0.0%) |
| 3 or more Vehicles | 208 (100.0%) | 0 (0.0%) |
| Total | 208 (100.0%) | 0 (0.0%) |
Real Estate & Mortgages in Canova
Real Estate and Mortgage Overview in Canova
| Characteristic | Without Mortgage | With Mortgage |
| Housing Units | 208 | 0 |
| Median Property Value | - | - |
| Median Household Income | - | - |
| Monthly Housing Costs | $433 | $0 |
| Real Estate Taxes | $1,084 | $0 |
Property Value by Mortgage Status in Canova
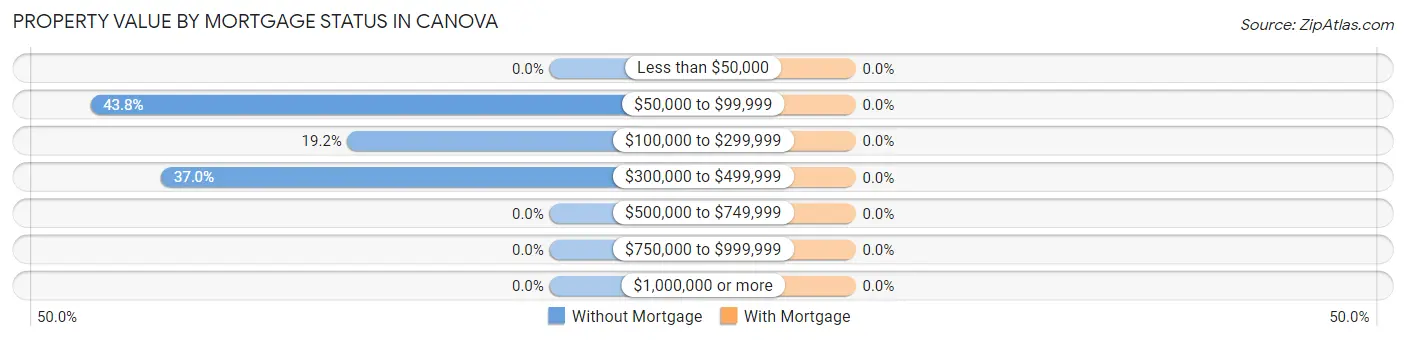
| Property Value | Without Mortgage | With Mortgage |
| Less than $50,000 | 0 (0.0%) | 0 (0.0%) |
| $50,000 to $99,999 | 91 (43.8%) | 0 (0.0%) |
| $100,000 to $299,999 | 40 (19.2%) | 0 (0.0%) |
| $300,000 to $499,999 | 77 (37.0%) | 0 (0.0%) |
| $500,000 to $749,999 | 0 (0.0%) | 0 (0.0%) |
| $750,000 to $999,999 | 0 (0.0%) | 0 (0.0%) |
| $1,000,000 or more | 0 (0.0%) | 0 (0.0%) |
| Total | 208 (100.0%) | 0 (0.0%) |
Household Income by Mortgage Status in Canova
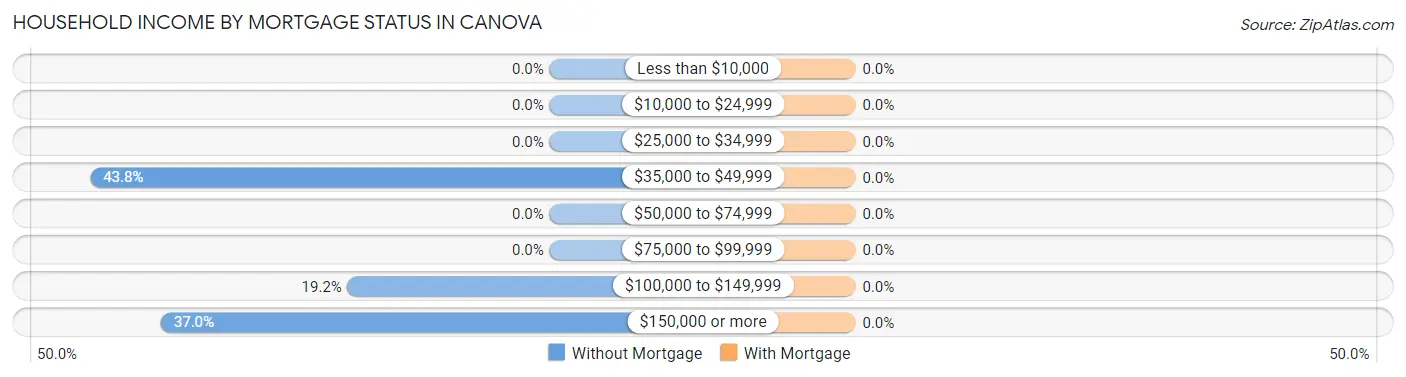
| Household Income | Without Mortgage | With Mortgage |
| Less than $10,000 | 0 (0.0%) | 0 (0.0%) |
| $10,000 to $24,999 | 0 (0.0%) | 0 (0.0%) |
| $25,000 to $34,999 | 0 (0.0%) | 0 (0.0%) |
| $35,000 to $49,999 | 91 (43.8%) | 0 (0.0%) |
| $50,000 to $74,999 | 0 (0.0%) | 0 (0.0%) |
| $75,000 to $99,999 | 0 (0.0%) | 0 (0.0%) |
| $100,000 to $149,999 | 40 (19.2%) | 0 (0.0%) |
| $150,000 or more | 77 (37.0%) | 0 (0.0%) |
| Total | 208 (100.0%) | 0 (0.0%) |
Property Value to Household Income Ratio in Canova
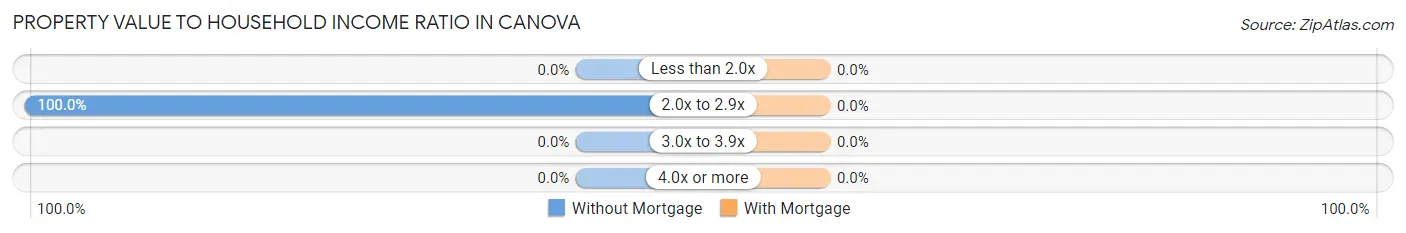
| Value-to-Income Ratio | Without Mortgage | With Mortgage |
| Less than 2.0x | 0 (0.0%) | 0 (0.0%) |
| 2.0x to 2.9x | 208 (100.0%) | 0 (0.0%) |
| 3.0x to 3.9x | 0 (0.0%) | 0 (0.0%) |
| 4.0x or more | 0 (0.0%) | 0 (0.0%) |
| Total | 208 (100.0%) | 0 (0.0%) |
Real Estate Taxes by Mortgage Status in Canova
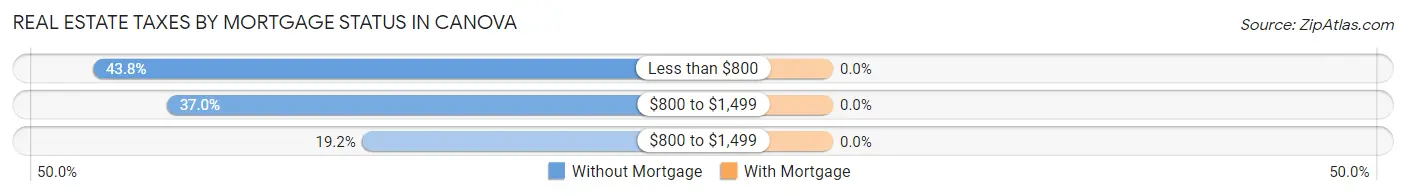
| Property Taxes | Without Mortgage | With Mortgage |
| Less than $800 | 91 (43.8%) | 0 (0.0%) |
| $800 to $1,499 | 77 (37.0%) | 0 (0.0%) |
| $800 to $1,499 | 40 (19.2%) | 0 (0.0%) |
| Total | 208 (100.0%) | 0 (0.0%) |
Health & Disability in Canova
Health Insurance Coverage by Age in Canova
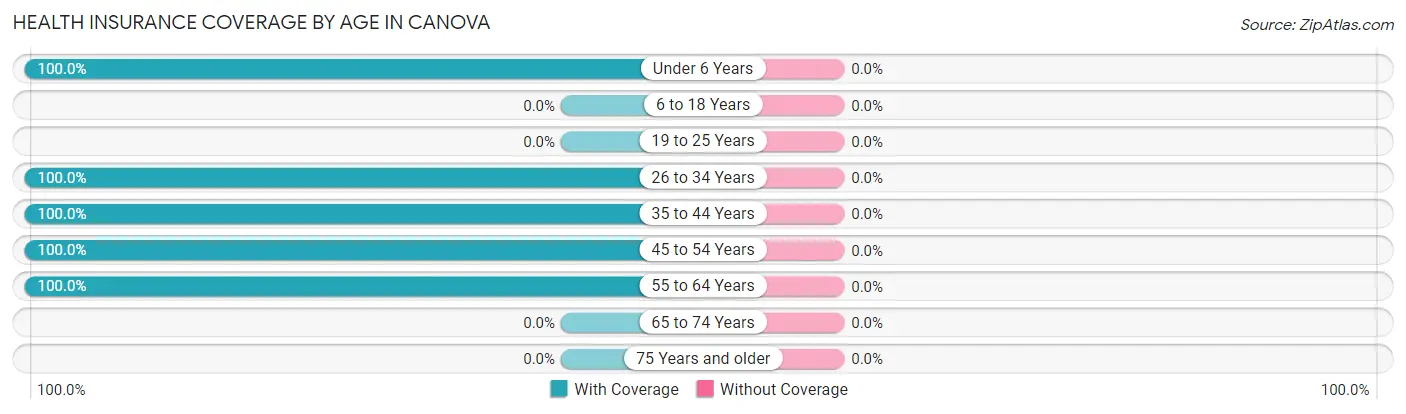
| Age Bracket | With Coverage | Without Coverage |
| Under 6 Years | 80 (100.0%) | 0 (0.0%) |
| 6 to 18 Years | 0 (0.0%) | 0 (0.0%) |
| 19 to 25 Years | 0 (0.0%) | 0 (0.0%) |
| 26 to 34 Years | 235 (100.0%) | 0 (0.0%) |
| 35 to 44 Years | 32 (100.0%) | 0 (0.0%) |
| 45 to 54 Years | 131 (100.0%) | 0 (0.0%) |
| 55 to 64 Years | 111 (100.0%) | 0 (0.0%) |
| 65 to 74 Years | 0 (0.0%) | 0 (0.0%) |
| 75 Years and older | 0 (0.0%) | 0 (0.0%) |
| Total | 589 (100.0%) | 0 (0.0%) |
Health Insurance Coverage by Citizenship Status in Canova
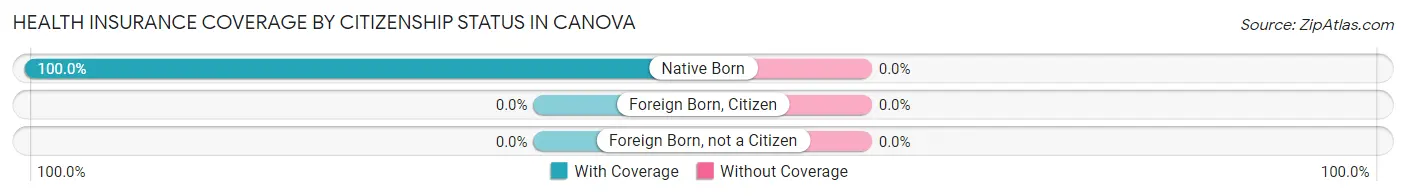
| Citizenship Status | With Coverage | Without Coverage |
| Native Born | 80 (100.0%) | 0 (0.0%) |
| Foreign Born, Citizen | 0 (0.0%) | 0 (0.0%) |
| Foreign Born, not a Citizen | 0 (0.0%) | 0 (0.0%) |
Health Insurance Coverage by Household Income in Canova
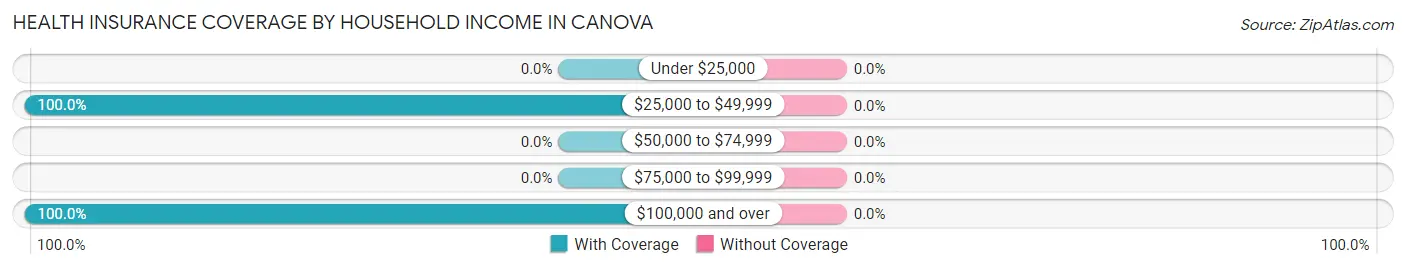
| Household Income | With Coverage | Without Coverage |
| Under $25,000 | 0 (0.0%) | 0 (0.0%) |
| $25,000 to $49,999 | 91 (100.0%) | 0 (0.0%) |
| $50,000 to $74,999 | 0 (0.0%) | 0 (0.0%) |
| $75,000 to $99,999 | 0 (0.0%) | 0 (0.0%) |
| $100,000 and over | 498 (100.0%) | 0 (0.0%) |
Public vs Private Health Insurance Coverage by Age in Canova
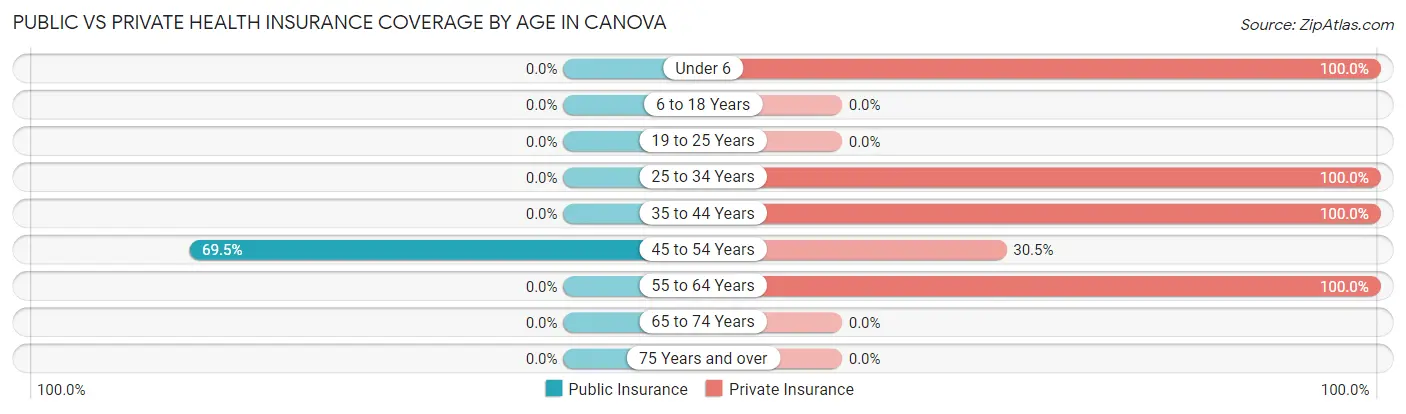
| Age Bracket | Public Insurance | Private Insurance |
| Under 6 | 0 (0.0%) | 80 (100.0%) |
| 6 to 18 Years | 0 (0.0%) | 0 (0.0%) |
| 19 to 25 Years | 0 (0.0%) | 0 (0.0%) |
| 25 to 34 Years | 0 (0.0%) | 235 (100.0%) |
| 35 to 44 Years | 0 (0.0%) | 32 (100.0%) |
| 45 to 54 Years | 91 (69.5%) | 40 (30.5%) |
| 55 to 64 Years | 0 (0.0%) | 111 (100.0%) |
| 65 to 74 Years | 0 (0.0%) | 0 (0.0%) |
| 75 Years and over | 0 (0.0%) | 0 (0.0%) |
| Total | 91 (15.4%) | 498 (84.6%) |
Disability Status by Sex by Age in Canova
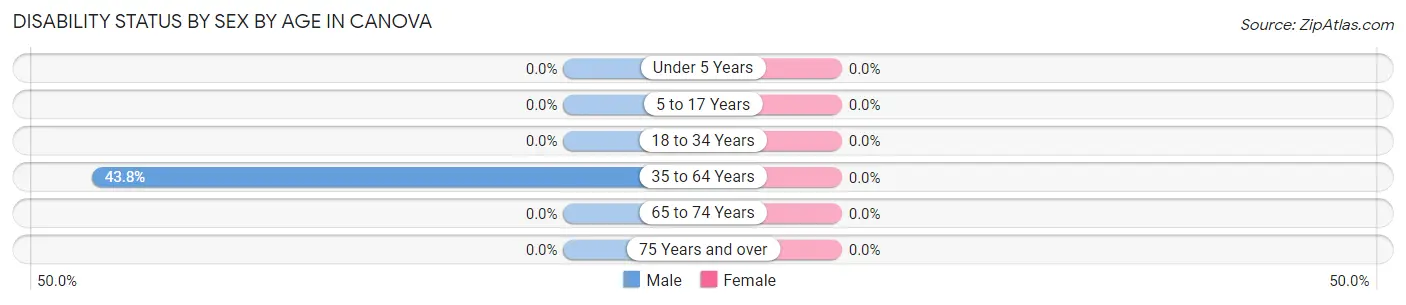
| Age Bracket | Male | Female |
| Under 5 Years | 0 (0.0%) | 0 (0.0%) |
| 5 to 17 Years | 0 (0.0%) | 0 (0.0%) |
| 18 to 34 Years | 0 (0.0%) | 0 (0.0%) |
| 35 to 64 Years | 91 (43.8%) | 0 (0.0%) |
| 65 to 74 Years | 0 (0.0%) | 0 (0.0%) |
| 75 Years and over | 0 (0.0%) | 0 (0.0%) |
Disability Class by Sex by Age in Canova
Disability Class: Hearing Difficulty
| Age Bracket | Male | Female |
| Under 5 Years | 0 (0.0%) | 0 (0.0%) |
| 5 to 17 Years | 0 (0.0%) | 0 (0.0%) |
| 18 to 34 Years | 0 (0.0%) | 0 (0.0%) |
| 35 to 64 Years | 0 (0.0%) | 0 (0.0%) |
| 65 to 74 Years | 0 (0.0%) | 0 (0.0%) |
| 75 Years and over | 0 (0.0%) | 0 (0.0%) |
Disability Class: Vision Difficulty

| Age Bracket | Male | Female |
| Under 5 Years | 0 (0.0%) | 0 (0.0%) |
| 5 to 17 Years | 0 (0.0%) | 0 (0.0%) |
| 18 to 34 Years | 0 (0.0%) | 0 (0.0%) |
| 35 to 64 Years | 0 (0.0%) | 0 (0.0%) |
| 65 to 74 Years | 0 (0.0%) | 0 (0.0%) |
| 75 Years and over | 0 (0.0%) | 0 (0.0%) |
Disability Class: Cognitive Difficulty
| Age Bracket | Male | Female |
| 5 to 17 Years | 0 (0.0%) | 0 (0.0%) |
| 18 to 34 Years | 0 (0.0%) | 0 (0.0%) |
| 35 to 64 Years | 0 (0.0%) | 0 (0.0%) |
| 65 to 74 Years | 0 (0.0%) | 0 (0.0%) |
| 75 Years and over | 0 (0.0%) | 0 (0.0%) |
Disability Class: Ambulatory Difficulty
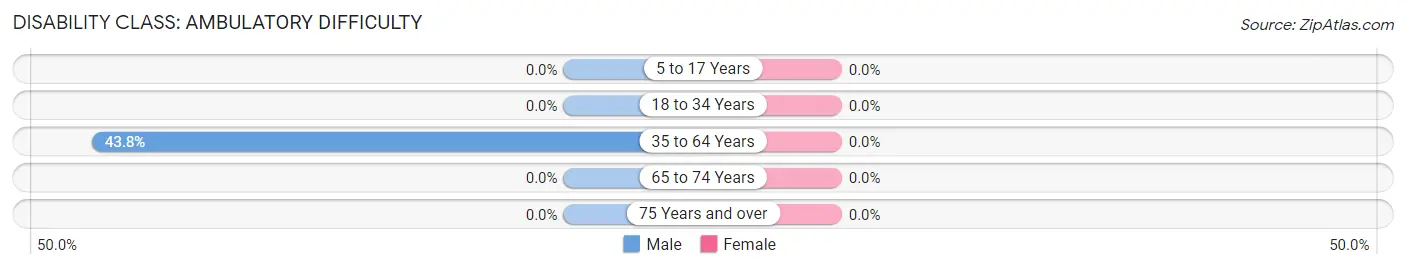
| Age Bracket | Male | Female |
| 5 to 17 Years | 0 (0.0%) | 0 (0.0%) |
| 18 to 34 Years | 0 (0.0%) | 0 (0.0%) |
| 35 to 64 Years | 91 (43.8%) | 0 (0.0%) |
| 65 to 74 Years | 0 (0.0%) | 0 (0.0%) |
| 75 Years and over | 0 (0.0%) | 0 (0.0%) |
Disability Class: Self-Care Difficulty
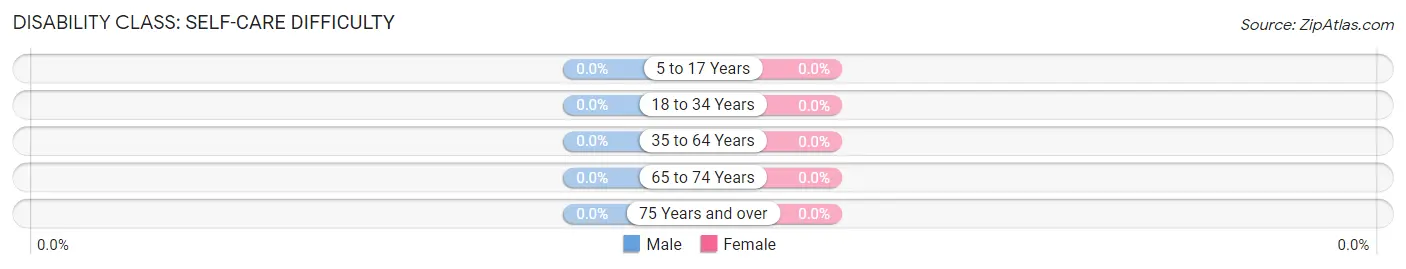
| Age Bracket | Male | Female |
| 5 to 17 Years | 0 (0.0%) | 0 (0.0%) |
| 18 to 34 Years | 0 (0.0%) | 0 (0.0%) |
| 35 to 64 Years | 0 (0.0%) | 0 (0.0%) |
| 65 to 74 Years | 0 (0.0%) | 0 (0.0%) |
| 75 Years and over | 0 (0.0%) | 0 (0.0%) |
Technology Access in Canova
Computing Device Access in Canova
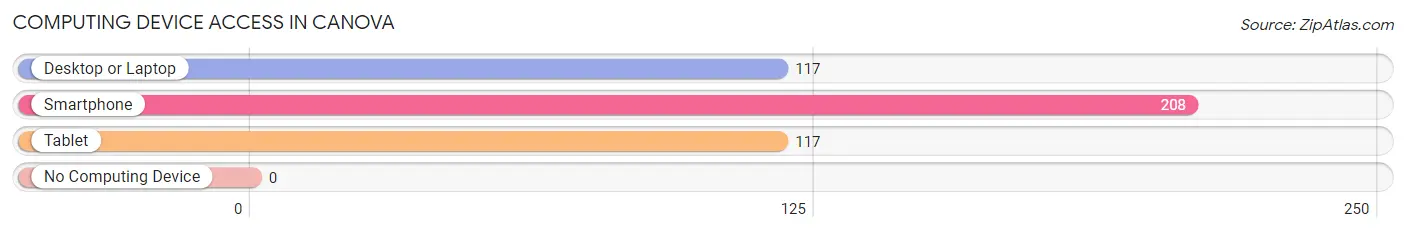
| Device Type | # Households | % Households |
| Desktop or Laptop | 117 | 56.2% |
| Smartphone | 208 | 100.0% |
| Tablet | 117 | 56.2% |
| No Computing Device | 0 | 0.0% |
| Total | 208 | 100.0% |
Internet Access in Canova

| Internet Type | # Households | % Households |
| Dial-Up Internet | 0 | 0.0% |
| Broadband Home | 40 | 19.2% |
| Cellular Data Only | 91 | 43.8% |
| Satellite Internet | 77 | 37.0% |
| No Internet | 0 | 0.0% |
| Total | 208 | 100.0% |
Canova Summary
Canova is a small unincorporated community located in Harding County, New Mexico. It is situated in the foothills of the Sangre de Cristo Mountains, approximately 25 miles east of the city of Mosquero. The town was founded in the late 1800s and has a population of approximately 200 people.
History
Canova was founded in the late 1800s by a group of settlers from the nearby town of Mosquero. The settlers were looking for a place to settle and raise their families. The town was named after the Italian sculptor Antonio Canova. The town was originally a farming community, but over time it has become a small ranching community.
Geography
Canova is located in the foothills of the Sangre de Cristo Mountains in Harding County, New Mexico. The town is situated at an elevation of 6,000 feet and is surrounded by rolling hills and grasslands. The climate is semi-arid, with hot summers and cold winters. The average annual precipitation is approximately 12 inches.
Economy
The economy of Canova is largely based on ranching and farming. The town is home to several small ranches and farms, which produce a variety of crops and livestock. The town also has a few small businesses, including a general store, a gas station, and a restaurant.
Demographics
As of the 2010 census, the population of Canova was approximately 200 people. The racial makeup of the town was 95.5% White, 0.5% African American, 0.5% Native American, 0.5% Asian, and 3% from other races. The median household income was $25,000, and the median age was 44 years.
Conclusion
Canova is a small unincorporated community located in Harding County, New Mexico. It was founded in the late 1800s and has a population of approximately 200 people. The town is situated in the foothills of the Sangre de Cristo Mountains and is largely based on ranching and farming. The racial makeup of the town is 95.5% White, 0.5% African American, 0.5% Native American, 0.5% Asian, and 3% from other races. The median household income was $25,000, and the median age was 44 years.
Common Questions
What is the Total Population of Canova?
Total Population of Canova is 589.
What is the Total Male Population of Canova?
Total Male Population of Canova is 341.
What is the Total Female Population of Canova?
Total Female Population of Canova is 248.
What is the Ratio of Males per 100 Females in Canova?
There are 137.50 Males per 100 Females in Canova.
What is the Ratio of Females per 100 Males in Canova?
There are 72.73 Females per 100 Males in Canova.
What is the Median Population Age in Canova?
Median Population Age in Canova is 30.8 Years.
What is the Average Family Size in Canova
Average Family Size in Canova is 4.3 People.
What is the Average Household Size in Canova
Average Household Size in Canova is 2.8 People.
What is Per Capita Income in Canova?
Per Capita income in Canova is $42,237.
What is Inequality or Gini Index in Canova?
Inequality or Gini Index in Canova is 0.32.
How Large is the Labor Force in Canova?
There are 296 People in the Labor Forcein in Canova.
What is the Percentage of People in the Labor Force in Canova?
58.2% of People are in the Labor Force in Canova.