Zip Codes with the Highest Percentage of Families with Income Above $100,000 in Butte, MT
RELATED REPORTS & OPTIONS
Family Income | $100k+
Butte
Compare Zip Codes
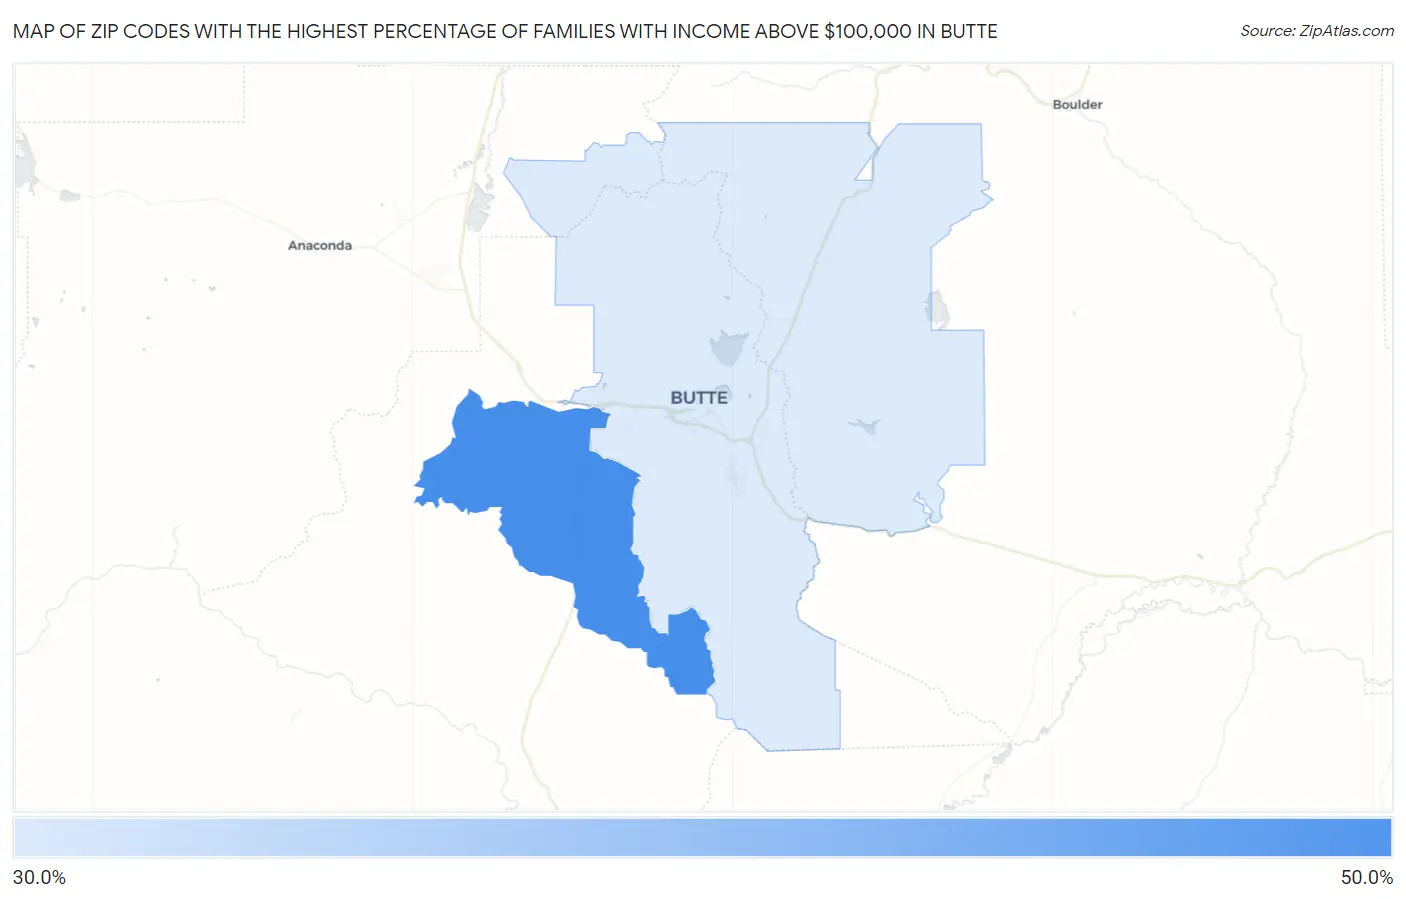
Map of Zip Codes with the Highest Percentage of Families with Income Above $100,000 in Butte
0.0%
50.0%
Zip Codes with the Highest Percentage of Families with Income Above $100,000 in Butte, MT
| Zip Code | Families with Income > $100k | vs State | vs National | |
| 1. | 59750 | 41.3% | 40.5%(+0.800)#118 | 46.1%(-4.80)#13,579 |
| 2. | 59701 | 35.2% | 40.5%(-5.30)#167 | 46.1%(-10.9)#17,738 |
1
Common Questions
What are the Top Zip Codes with the Highest Percentage of Families with Income Above $100,000 in Butte, MT?
Top Zip Codes with the Highest Percentage of Families with Income Above $100,000 in Butte, MT are:
What zip code has the Highest Percentage of Families with Income Above $100,000 in Butte, MT?
59750 has the Highest Percentage of Families with Income Above $100,000 in Butte, MT with 41.3%.
What is the Percentage of Families with Income Above $100,000 in Montana?
Percentage of Families with Income Above $100,000 in Montana is 40.5%.
What is the Percentage of Families with Income Above $100,000 in the United States?
Percentage of Families with Income Above $100,000 in the United States is 46.1%.