Zip Codes with the Highest Percentage of Population with a Degree in Science and Engineering in Butte, MT
RELATED REPORTS & OPTIONS
Science and Engineering
Butte
Compare Zip Codes
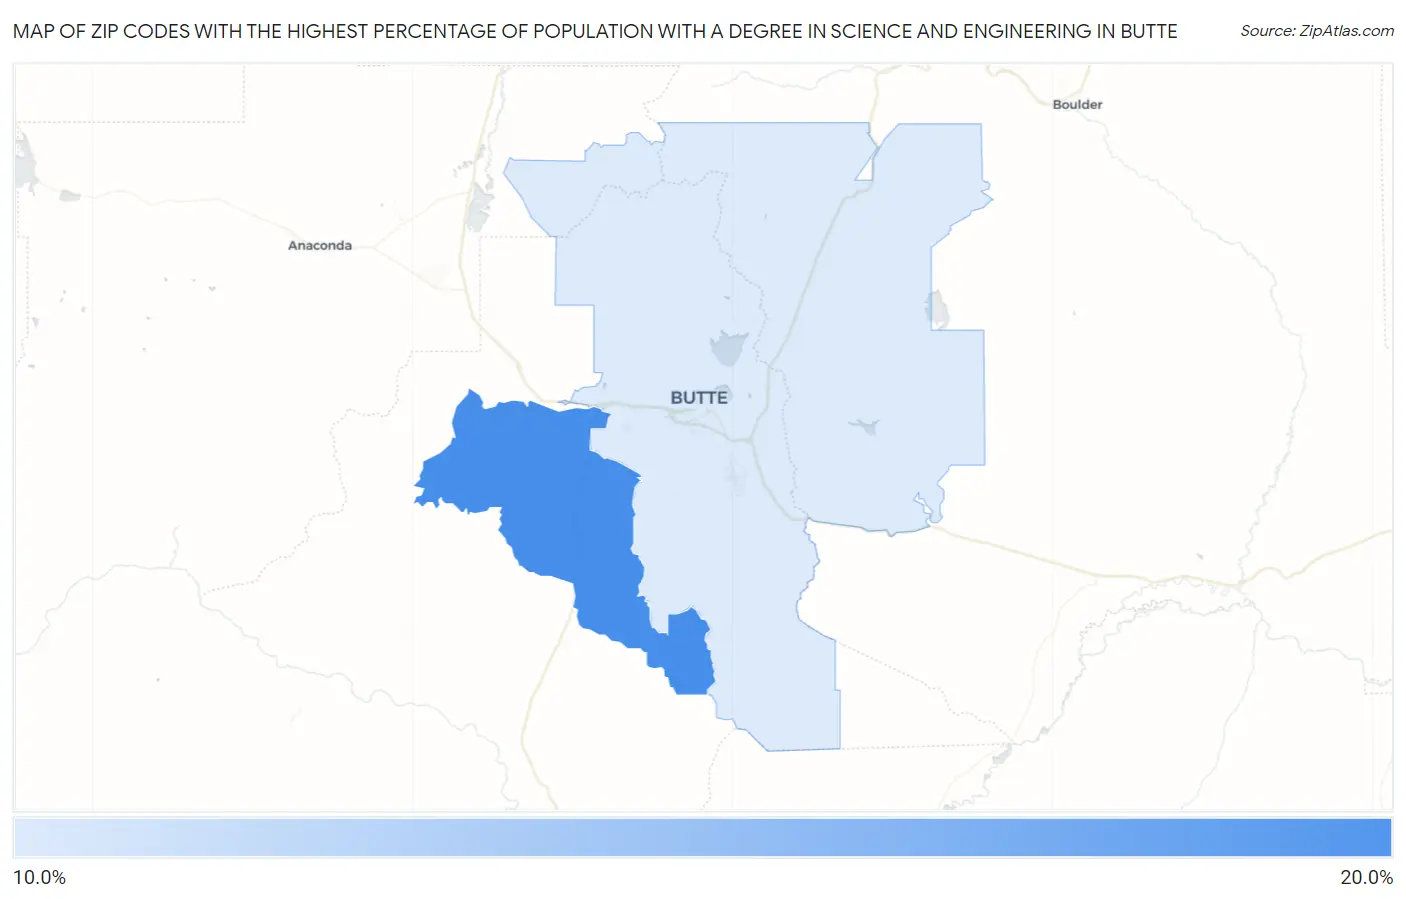
Map of Zip Codes with the Highest Percentage of Population with a Degree in Science and Engineering in Butte
0.0%
20.0%
Zip Codes with the Highest Percentage of Population with a Degree in Science and Engineering in Butte, MT
| Zip Code | % Graduates | vs State | vs National | |
| 1. | 59750 | 17.1% | 11.0%(+6.05)#60 | 9.8%(+7.29)#4,893 |
| 2. | 59701 | 14.3% | 11.0%(+3.31)#81 | 9.8%(+4.55)#7,413 |
1
Common Questions
What are the Top Zip Codes with the Highest Percentage of Population with a Degree in Science and Engineering in Butte, MT?
Top Zip Codes with the Highest Percentage of Population with a Degree in Science and Engineering in Butte, MT are:
What zip code has the Highest Percentage of Population with a Degree in Science and Engineering in Butte, MT?
59750 has the Highest Percentage of Population with a Degree in Science and Engineering in Butte, MT with 17.1%.
What is the Percentage of Population with a Degree in Science and Engineering in Montana?
Percentage of Population with a Degree in Science and Engineering in Montana is 11.0%.
What is the Percentage of Population with a Degree in Science and Engineering in the United States?
Percentage of Population with a Degree in Science and Engineering in the United States is 9.8%.