Zip Codes with the Highest Percentage of Households with Income Above $100,000 in Butte, MT
RELATED REPORTS & OPTIONS
Household Income | $100k+
Butte
Compare Zip Codes
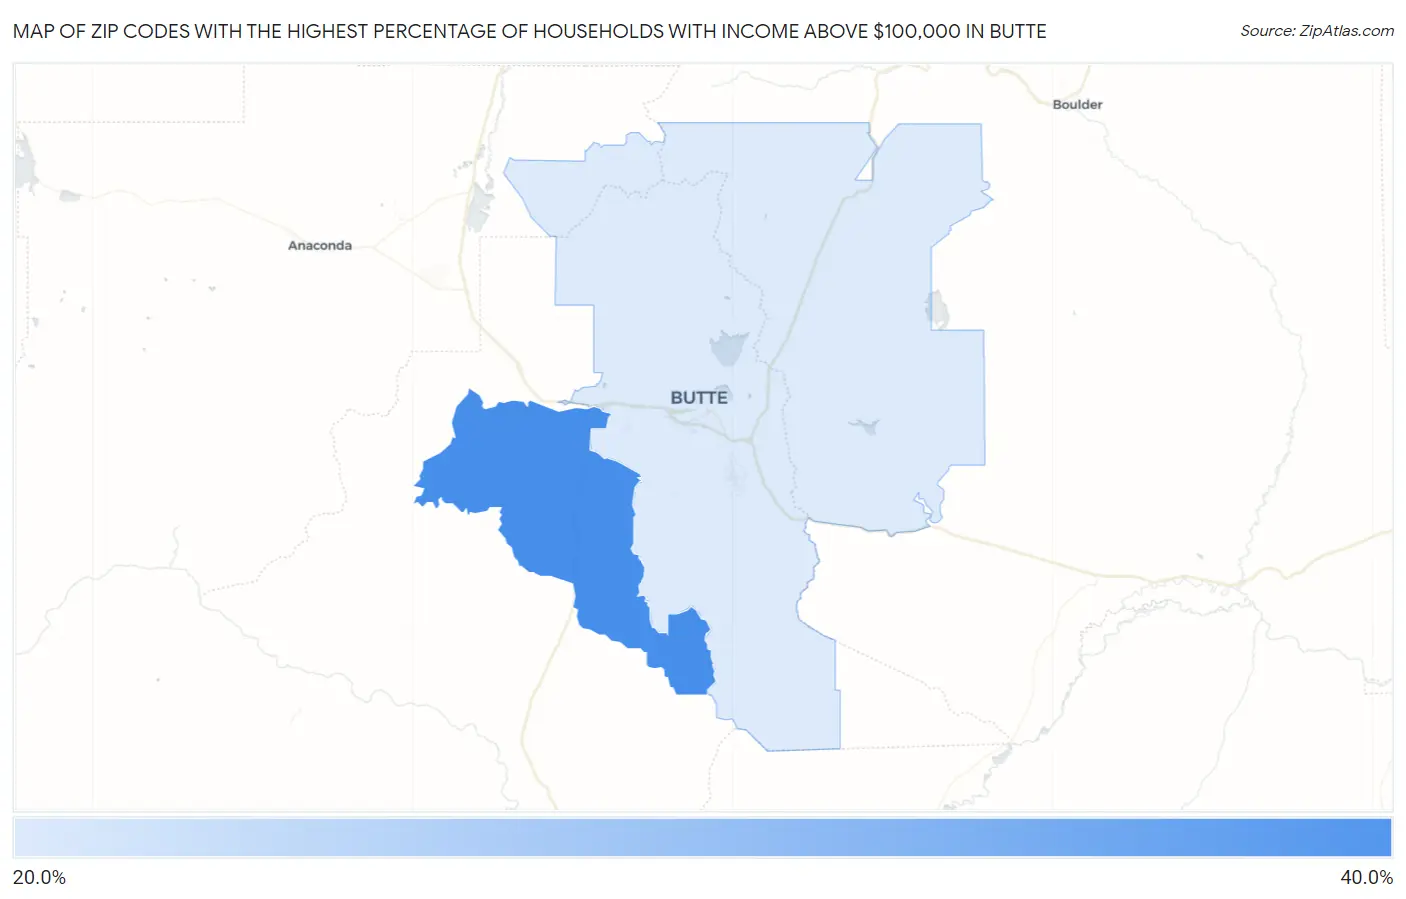
Map of Zip Codes with the Highest Percentage of Households with Income Above $100,000 in Butte
0.0%
40.0%
Zip Codes with the Highest Percentage of Households with Income Above $100,000 in Butte, MT
| Zip Code | Households with Income > $100k | vs State | vs National | |
| 1. | 59750 | 38.7% | 30.1%(+8.60)#67 | 37.3%(+1.40)#9,615 |
| 2. | 59701 | 23.5% | 30.1%(-6.60)#215 | 37.3%(-13.8)#21,117 |
1
Common Questions
What are the Top Zip Codes with the Highest Percentage of Households with Income Above $100,000 in Butte, MT?
Top Zip Codes with the Highest Percentage of Households with Income Above $100,000 in Butte, MT are:
What zip code has the Highest Percentage of Households with Income Above $100,000 in Butte, MT?
59750 has the Highest Percentage of Households with Income Above $100,000 in Butte, MT with 38.7%.
What is the Percentage of Households with Income Above $100,000 in Montana?
Percentage of Households with Income Above $100,000 in Montana is 30.1%.
What is the Percentage of Households with Income Above $100,000 in the United States?
Percentage of Households with Income Above $100,000 in the United States is 37.3%.