Zip Codes with the Highest Poverty Level Among Children Under the Age of 5 in Kansas City, MO

RELATED REPORTS & OPTIONS

Highest Poverty | Child 0-5
Population
Families and Households
Female Fertility
Female Fertility (Unmarried)
Race (Community Size)
Race (Percentage)
Ancestry (Community Size)
AfghanAfricanAlaska NativeAlbanianAmericanApacheArabArgentineanArmenianAustralianAustrianBahamianBangladeshiBelgianBelizeanBhutaneseBlackfeetBolivianBrazilianBritishBulgarianBurmeseCanadianCelticCentral AmericanCentral American IndianCherokeeChickasawChileanChippewaChoctawColombianComancheCosta RicanCreeCreekCroatianCrowCubanCzechCzechoslovakianDanishDominicanDutchDutch West IndianEastern EuropeanEcuadorianEgyptianEnglishEthiopianEuropeanFijianFilipinoFinnishFrenchFrench American IndianFrench CanadianGermanGerman RussianGhanaianGreekGuamanian / ChamorroGuatemalanGuyaneseHaitianHonduranHungarianIcelanderIndian (Asian)IndonesianIranianIraqiIrishIroquoisIsraeliItalianJamaicanJapaneseJordanianKenyanKoreanLaotianLatvianLebaneseLiberianLithuanianLuxembourgerMalaysianMexicanMexican American IndianMongolianMoroccanNative HawaiianNavajoNew ZealanderNicaraguanNigerianNorthern EuropeanNorwegianOsageOttawaPakistaniPalestinianPanamanianPennsylvania GermanPeruvianPolishPortuguesePotawatomiPuebloPuerto RicanRomanianRussianSalvadoranSamoanScandinavianScotch-IrishScottishSeminoleSerbianShoshoneSierra LeoneanSiouxSlavicSlovakSloveneSomaliSouth AfricanSouth AmericanSouth American IndianSpaniardSpanishSri LankanSubsaharan AfricanSudaneseSwedishSwissSyrianThaiTrinidadian and TobagonianTurkishUgandanUkrainianUruguayanVenezuelanVietnameseWelshWest IndianYugoslavian
Ancestry (Percentage)
AfghanAfricanAlaska NativeAlbanianAmericanApacheArabArgentineanArmenianAustralianAustrianBahamianBangladeshiBelgianBelizeanBhutaneseBlackfeetBolivianBrazilianBritishBulgarianBurmeseCanadianCelticCentral AmericanCentral American IndianCherokeeChickasawChileanChippewaChoctawColombianComancheCosta RicanCreeCreekCroatianCrowCubanCzechCzechoslovakianDanishDominicanDutchDutch West IndianEastern EuropeanEcuadorianEgyptianEnglishEthiopianEuropeanFijianFilipinoFinnishFrenchFrench American IndianFrench CanadianGermanGerman RussianGhanaianGreekGuamanian / ChamorroGuatemalanGuyaneseHaitianHonduranHungarianIcelanderIndian (Asian)IndonesianIranianIraqiIrishIroquoisIsraeliItalianJamaicanJapaneseJordanianKenyanKoreanLaotianLatvianLebaneseLiberianLithuanianLuxembourgerMalaysianMexicanMexican American IndianMongolianMoroccanNative HawaiianNavajoNew ZealanderNicaraguanNigerianNorthern EuropeanNorwegianOsageOttawaPakistaniPalestinianPanamanianPennsylvania GermanPeruvianPolishPortuguesePotawatomiPuebloPuerto RicanRomanianRussianSalvadoranSamoanScandinavianScotch-IrishScottishSeminoleSerbianShoshoneSierra LeoneanSiouxSlavicSlovakSloveneSomaliSouth AfricanSouth AmericanSouth American IndianSpaniardSpanishSri LankanSubsaharan AfricanSudaneseSwedishSwissSyrianThaiTrinidadian and TobagonianTurkishUgandanUkrainianUruguayanVenezuelanVietnameseWelshWest IndianYugoslavian
Immigrant Origin (Total)
AfghanistanAfricaArgentinaAsiaAustraliaBahamasBangladeshBelarusBelgiumBelizeBoliviaBosnia and HerzegovinaBrazilBulgariaBurma / MyanmarCambodiaCameroonCanadaCaribbeanCentral AmericaChileChinaColombiaCongoCosta RicaCubaCzechoslovakiaDenmarkDominican RepublicEastern AfricaEastern AsiaEastern EuropeEcuadorEgyptEl SalvadorEnglandEritreaEthiopiaEuropeFijiFranceGermanyGhanaGreeceGuatemalaGuyanaHaitiHondurasHong KongHungaryIndiaIndonesiaIranIraqIrelandIsraelItalyJamaicaJapanJordanKazakhstanKenyaKoreaKuwaitLaosLatin AmericaLebanonLiberiaMalaysiaMexicoMicronesiaMiddle AfricaMoroccoNepalNetherlandsNicaraguaNigeriaNorthern AfricaNorthern EuropeOceaniaPakistanPeruPhilippinesPolandPortugalRomaniaRussiaSaudi ArabiaScotlandSierra LeoneSomaliaSouth AfricaSouth AmericaSouth Central AsiaSouth Eastern AsiaSouthern EuropeSpainSri LankaSudanSwedenSwitzerlandSyriaTaiwanThailandTrinidad and TobagoTurkeyUgandaUkraineUruguayVenezuelaVietnamWestern AfricaWestern AsiaWestern EuropeZaireZimbabwe
Immigrant Origin (Percentage)
AfghanistanAfricaArgentinaAsiaAustraliaBahamasBangladeshBelarusBelgiumBelizeBoliviaBosnia and HerzegovinaBrazilBulgariaBurma / MyanmarCambodiaCameroonCanadaCaribbeanCentral AmericaChileChinaColombiaCongoCosta RicaCubaCzechoslovakiaDenmarkDominican RepublicEastern AfricaEastern AsiaEastern EuropeEcuadorEgyptEl SalvadorEnglandEritreaEthiopiaEuropeFijiFranceGermanyGhanaGreeceGuatemalaGuyanaHaitiHondurasHong KongHungaryIndiaIndonesiaIranIraqIrelandIsraelItalyJamaicaJapanJordanKazakhstanKenyaKoreaKuwaitLaosLatin AmericaLebanonLiberiaMalaysiaMexicoMicronesiaMiddle AfricaMoroccoNepalNetherlandsNicaraguaNigeriaNorthern AfricaNorthern EuropeOceaniaPakistanPeruPhilippinesPolandPortugalRomaniaRussiaSaudi ArabiaScotlandSierra LeoneSomaliaSouth AfricaSouth AmericaSouth Central AsiaSouth Eastern AsiaSouthern EuropeSpainSri LankaSudanSwedenSwitzerlandSyriaTaiwanThailandTrinidad and TobagoTurkeyUgandaUkraineUruguayVenezuelaVietnamWestern AfricaWestern AsiaWestern EuropeZaireZimbabwe
Income
Income (Families)
Income (Households)
Poverty
Poverty (Families)
Unemployment
Employment Occupations
Employment Industries
Employer Class
Commute Time
Commute Means
School Enrollment
Education by Degree Field
Occupancy
Finances
Physical Characteristics
Kansas City
Compare Zip Codes
Comparison Subject

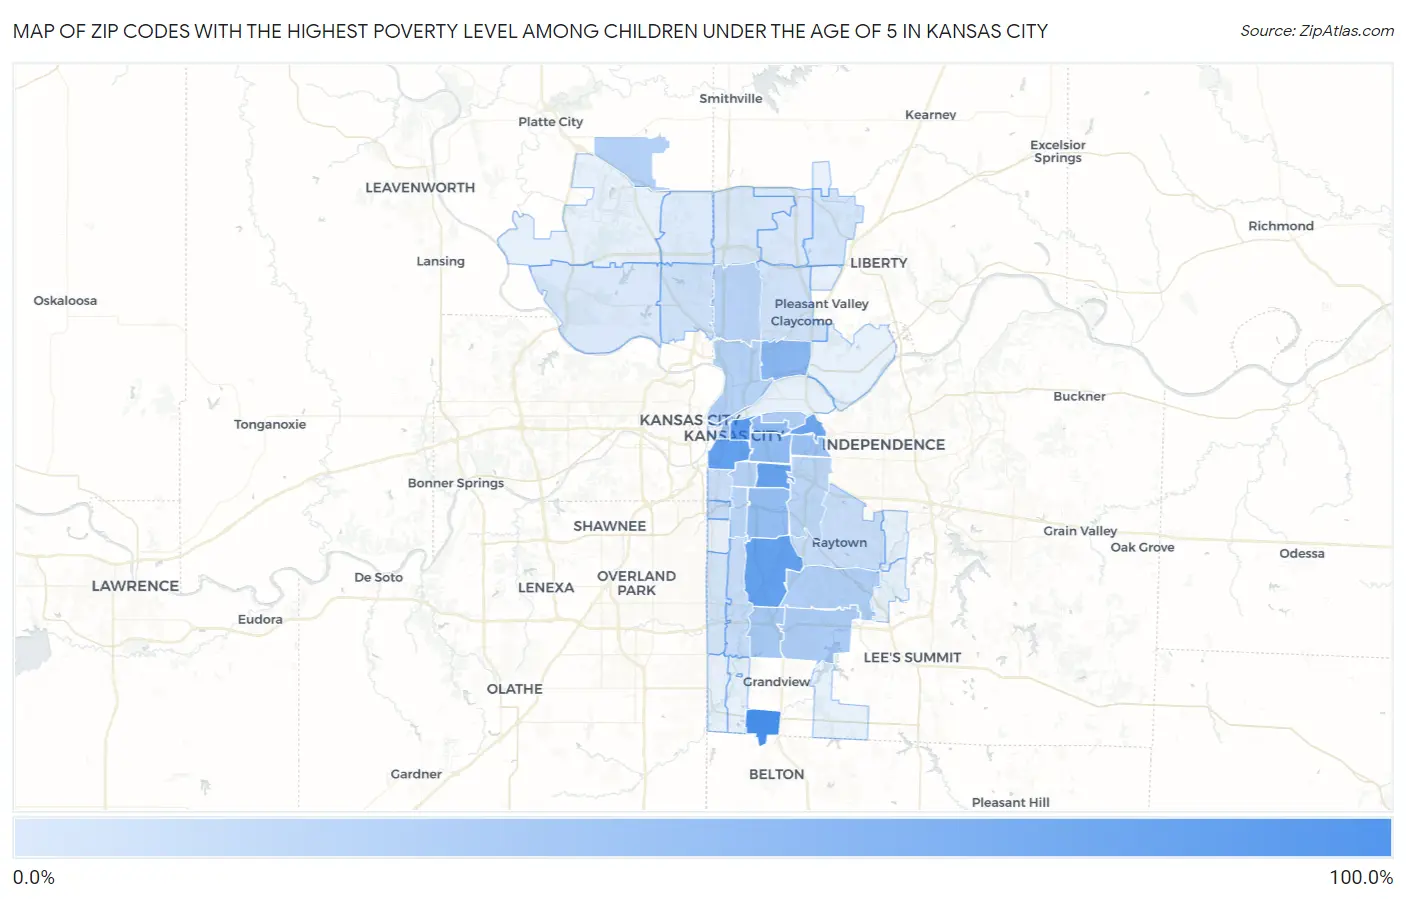
Map of Zip Codes with the Highest Poverty Level Among Children Under the Age of 5 in Kansas City

0.0%
100.0%
Zip Codes with the Highest Poverty Level Among Children Under the Age of 5 in Kansas City Map

Zip Codes with the Highest Poverty Level Among Children Under the Age of 5 in Kansas City, MO

Zip Code Child Poverty vs State vs National
1.64147100.0%18.4%(+81.6)#718.1%(+81.9)#205
2.6410679.8%18.4%(+61.4)#3418.1%(+61.8)#827
3.6410877.1%18.4%(+58.7)#3618.1%(+59.0)#895
4.6413274.5%18.4%(+56.1)#3918.1%(+56.4)#988
5.6412872.0%18.4%(+53.6)#4018.1%(+54.0)#1,080
6.6412567.7%18.4%(+49.3)#4918.1%(+49.6)#1,244
7.6411747.1%18.4%(+28.7)#11318.1%(+29.1)#2,909
8.6412442.7%18.4%(+24.3)#12918.1%(+24.7)#3,533
9.6412742.4%18.4%(+24.0)#13118.1%(+24.4)#3,582
10.6413039.1%18.4%(+20.7)#15718.1%(+21.1)#4,180
11.6412636.2%18.4%(+17.8)#17318.1%(+18.2)#4,769
12.6410533.3%18.4%(+14.9)#20118.1%(+15.3)#5,434
13.6413728.0%18.4%(+9.56)#26118.1%(+9.91)#6,972
14.6413426.3%18.4%(+7.87)#28418.1%(+8.22)#7,553
15.6412324.0%18.4%(+5.62)#31418.1%(+5.97)#8,337
16.6413823.0%18.4%(+4.62)#32818.1%(+4.97)#8,757
17.6416322.4%18.4%(+3.94)#33418.1%(+4.29)#9,021
18.6411621.0%18.4%(+2.56)#35418.1%(+2.91)#9,611
19.6410920.9%18.4%(+2.45)#35618.1%(+2.80)#9,649
20.6411819.2%18.4%(+0.765)#37818.1%(+1.12)#10,423
21.6411018.8%18.4%(+0.358)#38318.1%(+0.710)#10,601
22.6412917.4%18.4%(-0.967)#39618.1%(-0.615)#11,215
23.6411212.1%18.4%(-6.35)#48518.1%(-5.99)#14,165
24.6413311.2%18.4%(-7.23)#50518.1%(-6.88)#14,698
25.6413110.4%18.4%(-8.00)#51718.1%(-7.65)#15,164
26.6411110.3%18.4%(-8.09)#52018.1%(-7.74)#15,212
27.641517.6%18.4%(-10.8)#56318.1%(-10.5)#17,022
28.641196.6%18.4%(-11.8)#57718.1%(-11.5)#17,670
29.641575.2%18.4%(-13.2)#60718.1%(-12.9)#18,644
30.641145.0%18.4%(-13.4)#61218.1%(-13.1)#18,789
31.641553.6%18.4%(-14.8)#64018.1%(-14.5)#19,811
32.641522.5%18.4%(-15.9)#65618.1%(-15.5)#20,492
33.641562.2%18.4%(-16.2)#66218.1%(-15.8)#20,683
34.641540.94%18.4%(-17.5)#68818.1%(-17.1)#21,422

Common Questions

What are the Top 10 Zip Codes with the Highest Poverty Level Among Children Under the Age of 5 in Kansas City, MO?
Top 10 Zip Codes with the Highest Poverty Level Among Children Under the Age of 5 in Kansas City, MO are:
#1
100.0%
#2
79.8%
#3
77.1%
#4
74.5%
#5
72.0%
#6
67.7%
#7
47.1%
#8
42.7%
#9
42.4%
#10
39.1%
What zip code has the Highest Poverty Level Among Children Under the Age of 5 in Kansas City, MO?
64147 has the Highest Poverty Level Among Children Under the Age of 5 in Kansas City, MO with 100.0%.
What is the Poverty Level Among Children Under the Age of 5 in Kansas City, MO?
Poverty Level Among Children Under the Age of 5 in Kansas City is 23.3%.
What is the Poverty Level Among Children Under the Age of 5 in Missouri?
Poverty Level Among Children Under the Age of 5 in Missouri is 18.4%.
What is the Poverty Level Among Children Under the Age of 5 in the United States?
Poverty Level Among Children Under the Age of 5 in the United States is 18.1%.