Zip Codes with the Highest Percentage of Self-Employed / Not Incorporated in Kansas City, MO

RELATED REPORTS & OPTIONS

Self-Employed / Not Incorporated
Population
Families and Households
Female Fertility
Female Fertility (Unmarried)
Race (Community Size)
Race (Percentage)
Ancestry (Community Size)
AfghanAfricanAlaska NativeAlbanianAmericanApacheArabArgentineanArmenianAustralianAustrianBahamianBangladeshiBelgianBelizeanBhutaneseBlackfeetBolivianBrazilianBritishBulgarianBurmeseCanadianCelticCentral AmericanCentral American IndianCherokeeChickasawChileanChippewaChoctawColombianComancheCosta RicanCreeCreekCroatianCrowCubanCzechCzechoslovakianDanishDominicanDutchDutch West IndianEastern EuropeanEcuadorianEgyptianEnglishEthiopianEuropeanFijianFilipinoFinnishFrenchFrench American IndianFrench CanadianGermanGerman RussianGhanaianGreekGuamanian / ChamorroGuatemalanGuyaneseHaitianHonduranHungarianIcelanderIndian (Asian)IndonesianIranianIraqiIrishIroquoisIsraeliItalianJamaicanJapaneseJordanianKenyanKoreanLaotianLatvianLebaneseLiberianLithuanianLuxembourgerMalaysianMexicanMexican American IndianMongolianMoroccanNative HawaiianNavajoNew ZealanderNicaraguanNigerianNorthern EuropeanNorwegianOsageOttawaPakistaniPalestinianPanamanianPennsylvania GermanPeruvianPolishPortuguesePotawatomiPuebloPuerto RicanRomanianRussianSalvadoranSamoanScandinavianScotch-IrishScottishSeminoleSerbianShoshoneSierra LeoneanSiouxSlavicSlovakSloveneSomaliSouth AfricanSouth AmericanSouth American IndianSpaniardSpanishSri LankanSubsaharan AfricanSudaneseSwedishSwissSyrianThaiTrinidadian and TobagonianTurkishUgandanUkrainianUruguayanVenezuelanVietnameseWelshWest IndianYugoslavian
Ancestry (Percentage)
AfghanAfricanAlaska NativeAlbanianAmericanApacheArabArgentineanArmenianAustralianAustrianBahamianBangladeshiBelgianBelizeanBhutaneseBlackfeetBolivianBrazilianBritishBulgarianBurmeseCanadianCelticCentral AmericanCentral American IndianCherokeeChickasawChileanChippewaChoctawColombianComancheCosta RicanCreeCreekCroatianCrowCubanCzechCzechoslovakianDanishDominicanDutchDutch West IndianEastern EuropeanEcuadorianEgyptianEnglishEthiopianEuropeanFijianFilipinoFinnishFrenchFrench American IndianFrench CanadianGermanGerman RussianGhanaianGreekGuamanian / ChamorroGuatemalanGuyaneseHaitianHonduranHungarianIcelanderIndian (Asian)IndonesianIranianIraqiIrishIroquoisIsraeliItalianJamaicanJapaneseJordanianKenyanKoreanLaotianLatvianLebaneseLiberianLithuanianLuxembourgerMalaysianMexicanMexican American IndianMongolianMoroccanNative HawaiianNavajoNew ZealanderNicaraguanNigerianNorthern EuropeanNorwegianOsageOttawaPakistaniPalestinianPanamanianPennsylvania GermanPeruvianPolishPortuguesePotawatomiPuebloPuerto RicanRomanianRussianSalvadoranSamoanScandinavianScotch-IrishScottishSeminoleSerbianShoshoneSierra LeoneanSiouxSlavicSlovakSloveneSomaliSouth AfricanSouth AmericanSouth American IndianSpaniardSpanishSri LankanSubsaharan AfricanSudaneseSwedishSwissSyrianThaiTrinidadian and TobagonianTurkishUgandanUkrainianUruguayanVenezuelanVietnameseWelshWest IndianYugoslavian
Immigrant Origin (Total)
AfghanistanAfricaArgentinaAsiaAustraliaBahamasBangladeshBelarusBelgiumBelizeBoliviaBosnia and HerzegovinaBrazilBulgariaBurma / MyanmarCambodiaCameroonCanadaCaribbeanCentral AmericaChileChinaColombiaCongoCosta RicaCubaCzechoslovakiaDenmarkDominican RepublicEastern AfricaEastern AsiaEastern EuropeEcuadorEgyptEl SalvadorEnglandEritreaEthiopiaEuropeFijiFranceGermanyGhanaGreeceGuatemalaGuyanaHaitiHondurasHong KongHungaryIndiaIndonesiaIranIraqIrelandIsraelItalyJamaicaJapanJordanKazakhstanKenyaKoreaKuwaitLaosLatin AmericaLebanonLiberiaMalaysiaMexicoMicronesiaMiddle AfricaMoroccoNepalNetherlandsNicaraguaNigeriaNorthern AfricaNorthern EuropeOceaniaPakistanPeruPhilippinesPolandPortugalRomaniaRussiaSaudi ArabiaScotlandSierra LeoneSomaliaSouth AfricaSouth AmericaSouth Central AsiaSouth Eastern AsiaSouthern EuropeSpainSri LankaSudanSwedenSwitzerlandSyriaTaiwanThailandTrinidad and TobagoTurkeyUgandaUkraineUruguayVenezuelaVietnamWestern AfricaWestern AsiaWestern EuropeZaireZimbabwe
Immigrant Origin (Percentage)
AfghanistanAfricaArgentinaAsiaAustraliaBahamasBangladeshBelarusBelgiumBelizeBoliviaBosnia and HerzegovinaBrazilBulgariaBurma / MyanmarCambodiaCameroonCanadaCaribbeanCentral AmericaChileChinaColombiaCongoCosta RicaCubaCzechoslovakiaDenmarkDominican RepublicEastern AfricaEastern AsiaEastern EuropeEcuadorEgyptEl SalvadorEnglandEritreaEthiopiaEuropeFijiFranceGermanyGhanaGreeceGuatemalaGuyanaHaitiHondurasHong KongHungaryIndiaIndonesiaIranIraqIrelandIsraelItalyJamaicaJapanJordanKazakhstanKenyaKoreaKuwaitLaosLatin AmericaLebanonLiberiaMalaysiaMexicoMicronesiaMiddle AfricaMoroccoNepalNetherlandsNicaraguaNigeriaNorthern AfricaNorthern EuropeOceaniaPakistanPeruPhilippinesPolandPortugalRomaniaRussiaSaudi ArabiaScotlandSierra LeoneSomaliaSouth AfricaSouth AmericaSouth Central AsiaSouth Eastern AsiaSouthern EuropeSpainSri LankaSudanSwedenSwitzerlandSyriaTaiwanThailandTrinidad and TobagoTurkeyUgandaUkraineUruguayVenezuelaVietnamWestern AfricaWestern AsiaWestern EuropeZaireZimbabwe
Income
Income (Families)
Income (Households)
Poverty
Poverty (Families)
Unemployment
Employment Occupations
Employment Industries
Employer Class
Commute Time
Commute Means
School Enrollment
Education by Degree Field
Occupancy
Finances
Physical Characteristics
Kansas City
Compare Zip Codes
Comparison Subject

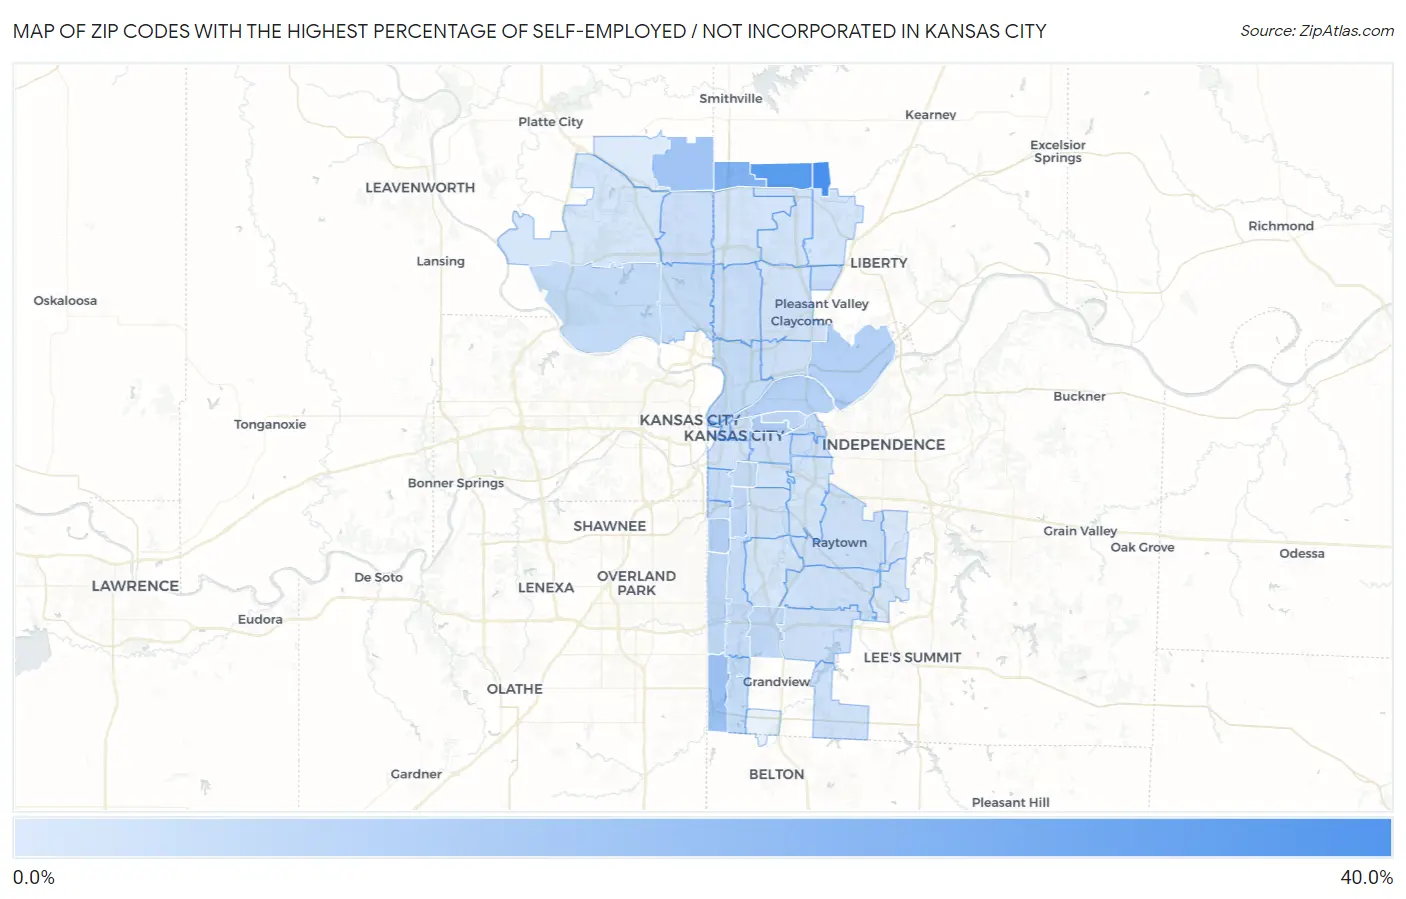
Map of Zip Codes with the Highest Percentage of Self-Employed / Not Incorporated in Kansas City

0.0%
40.0%
Zip Codes with the Highest Percentage of Self-Employed / Not Incorporated in Kansas City Map

Zip Codes with the Highest Percentage of Self-Employed / Not Incorporated in Kansas City, MO

Zip Code % Self-Employed / Not Incorporated vs State vs National
1.6416731.3%5.5%(+25.8)#205.8%(+25.5)#707
2.6416627.9%5.5%(+22.4)#335.8%(+22.1)#902
3.6416518.7%5.5%(+13.2)#905.8%(+12.9)#2,124
4.6414513.7%5.5%(+8.16)#1755.8%(+7.86)#4,081
5.6416412.3%5.5%(+6.77)#2245.8%(+6.47)#5,061
6.641249.7%5.5%(+4.17)#3255.8%(+3.87)#7,766
7.641618.6%5.5%(+3.08)#3685.8%(+2.78)#9,475
8.641208.5%5.5%(+2.97)#3725.8%(+2.67)#9,673
9.641138.4%5.5%(+2.87)#3775.8%(+2.57)#9,885
10.641146.6%5.5%(+1.10)#4975.8%(+0.796)#14,098
11.641376.3%5.5%(+0.829)#5215.8%(+0.527)#14,936
12.641236.2%5.5%(+0.647)#5365.8%(+0.346)#15,539
13.641106.1%5.5%(+0.587)#5395.8%(+0.285)#15,729
14.641095.7%5.5%(+0.205)#5645.8%(-0.096)#16,960
15.641525.7%5.5%(+0.201)#5655.8%(-0.100)#16,979
16.641515.5%5.5%(-0.003)#5905.8%(-0.304)#17,735
17.641165.5%5.5%(-0.039)#5945.8%(-0.341)#17,858
18.641255.3%5.5%(-0.223)#6095.8%(-0.525)#18,554
19.641115.2%5.5%(-0.265)#6175.8%(-0.566)#18,724
20.641465.2%5.5%(-0.275)#6195.8%(-0.577)#18,759
21.641585.0%5.5%(-0.503)#6425.8%(-0.805)#19,627
22.641184.9%5.5%(-0.617)#6515.8%(-0.919)#20,069
23.641314.9%5.5%(-0.650)#6555.8%(-0.952)#20,169
24.641544.7%5.5%(-0.810)#6665.8%(-1.11)#20,779
25.641054.6%5.5%(-0.873)#6725.8%(-1.17)#21,008
26.641124.5%5.5%(-1.04)#6935.8%(-1.35)#21,689
27.641264.3%5.5%(-1.19)#7115.8%(-1.49)#22,221
28.641274.2%5.5%(-1.33)#7305.8%(-1.63)#22,746
29.641334.2%5.5%(-1.33)#7315.8%(-1.64)#22,755
30.641344.0%5.5%(-1.46)#7485.8%(-1.77)#23,219
31.641383.8%5.5%(-1.69)#7655.8%(-2.00)#24,006
32.641493.8%5.5%(-1.74)#7745.8%(-2.04)#24,155
33.641173.7%5.5%(-1.80)#7795.8%(-2.10)#24,360
34.641303.4%5.5%(-2.13)#8145.8%(-2.43)#25,351
35.641193.4%5.5%(-2.14)#8175.8%(-2.44)#25,383
36.641063.3%5.5%(-2.20)#8225.8%(-2.50)#25,556
37.641083.3%5.5%(-2.22)#8265.8%(-2.52)#25,617
38.641563.1%5.5%(-2.38)#8355.8%(-2.68)#26,022
39.641283.0%5.5%(-2.51)#8425.8%(-2.81)#26,360
40.641572.8%5.5%(-2.70)#8515.8%(-3.00)#26,810
41.641292.8%5.5%(-2.73)#8565.8%(-3.03)#26,867
42.641552.7%5.5%(-2.78)#8595.8%(-3.08)#26,957
43.641322.5%5.5%(-3.04)#8695.8%(-3.34)#27,456
44.641532.3%5.5%(-3.22)#8765.8%(-3.52)#27,783
45.641391.9%5.5%(-3.65)#8985.8%(-3.95)#28,409
46.641361.6%5.5%(-3.94)#9075.8%(-4.24)#28,663
47.641631.2%5.5%(-4.28)#9175.8%(-4.58)#28,966

Common Questions

What are the Top 10 Zip Codes with the Highest Percentage of Self-Employed / Not Incorporated in Kansas City, MO?
Top 10 Zip Codes with the Highest Percentage of Self-Employed / Not Incorporated in Kansas City, MO are:
#1
31.3%
#2
27.9%
#3
18.7%
#4
13.7%
#5
12.3%
#6
9.7%
#7
8.6%
#8
8.5%
#9
8.4%
#10
6.6%
What zip code has the Highest Percentage of Self-Employed / Not Incorporated in Kansas City, MO?
64167 has the Highest Percentage of Self-Employed / Not Incorporated in Kansas City, MO with 31.3%.
What is the Percentage of Self-Employed / Not Incorporated in Kansas City, MO?
Percentage of Self-Employed / Not Incorporated in Kansas City is 4.7%.
What is the Percentage of Self-Employed / Not Incorporated in Missouri?
Percentage of Self-Employed / Not Incorporated in Missouri is 5.5%.
What is the Percentage of Self-Employed / Not Incorporated in the United States?
Percentage of Self-Employed / Not Incorporated in the United States is 5.8%.