Zip Codes with the Highest Percentage of Population with a Degree in Visual and Performing Arts in Saint Paul, MN
RELATED REPORTS & OPTIONS
Visual and Performing Arts
Saint Paul
Compare Zip Codes
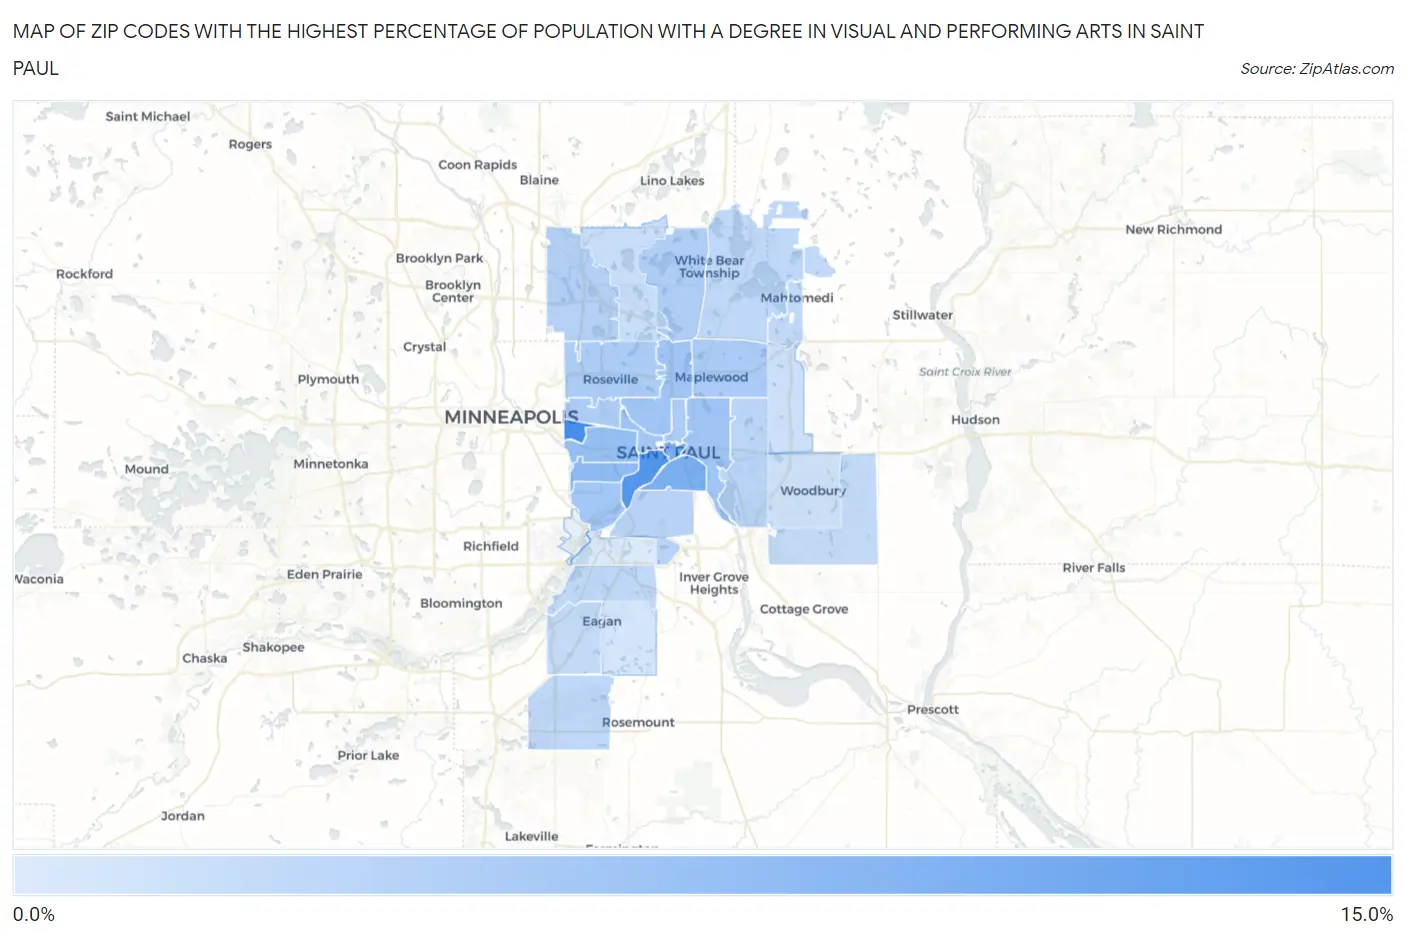
Map of Zip Codes with the Highest Percentage of Population with a Degree in Visual and Performing Arts in Saint Paul
0.0%
15.0%
Zip Codes with the Highest Percentage of Population with a Degree in Visual and Performing Arts in Saint Paul, MN
| Zip Code | % Graduates | vs State | vs National | |
| 1. | 55114 | 13.7% | 4.3%(+9.46)#15 | 4.3%(+9.49)#987 |
| 2. | 55102 | 12.6% | 4.3%(+8.29)#21 | 4.3%(+8.32)#1,180 |
| 3. | 55101 | 9.5% | 4.3%(+5.20)#38 | 4.3%(+5.23)#2,028 |
| 4. | 55107 | 9.3% | 4.3%(+5.01)#47 | 4.3%(+5.04)#2,120 |
| 5. | 55105 | 7.6% | 4.3%(+3.34)#64 | 4.3%(+3.37)#3,127 |
| 6. | 55104 | 7.1% | 4.3%(+2.82)#76 | 4.3%(+2.85)#3,559 |
| 7. | 55106 | 6.1% | 4.3%(+1.85)#111 | 4.3%(+1.88)#4,702 |
| 8. | 55117 | 6.1% | 4.3%(+1.82)#112 | 4.3%(+1.85)#4,729 |
| 9. | 55116 | 5.9% | 4.3%(+1.66)#116 | 4.3%(+1.69)#4,944 |
| 10. | 55103 | 5.9% | 4.3%(+1.66)#117 | 4.3%(+1.69)#4,956 |
| 11. | 55109 | 5.4% | 4.3%(+1.08)#134 | 4.3%(+1.11)#5,926 |
| 12. | 55130 | 5.2% | 4.3%(+0.953)#141 | 4.3%(+0.982)#6,178 |
| 13. | 55113 | 5.2% | 4.3%(+0.937)#142 | 4.3%(+0.966)#6,208 |
| 14. | 55108 | 5.2% | 4.3%(+0.889)#149 | 4.3%(+0.919)#6,296 |
| 15. | 55127 | 5.0% | 4.3%(+0.702)#156 | 4.3%(+0.731)#6,689 |
| 16. | 55112 | 4.8% | 4.3%(+0.470)#167 | 4.3%(+0.499)#7,188 |
| 17. | 55118 | 4.3% | 4.3%(+0.061)#208 | 4.3%(+0.090)#8,236 |
| 18. | 55119 | 4.1% | 4.3%(-0.143)#221 | 4.3%(-0.114)#8,803 |
| 19. | 55121 | 3.8% | 4.3%(-0.461)#241 | 4.3%(-0.432)#9,806 |
| 20. | 55110 | 3.8% | 4.3%(-0.517)#246 | 4.3%(-0.488)#9,957 |
| 21. | 55124 | 3.7% | 4.3%(-0.573)#252 | 4.3%(-0.544)#10,132 |
| 22. | 55115 | 3.6% | 4.3%(-0.647)#260 | 4.3%(-0.618)#10,388 |
| 23. | 55122 | 3.3% | 4.3%(-0.933)#292 | 4.3%(-0.904)#11,424 |
| 24. | 55129 | 3.3% | 4.3%(-0.942)#294 | 4.3%(-0.913)#11,457 |
| 25. | 55126 | 3.1% | 4.3%(-1.17)#333 | 4.3%(-1.14)#12,309 |
| 26. | 55128 | 2.7% | 4.3%(-1.54)#377 | 4.3%(-1.51)#13,745 |
| 27. | 55125 | 2.5% | 4.3%(-1.76)#401 | 4.3%(-1.73)#14,530 |
| 28. | 55123 | 2.1% | 4.3%(-2.18)#454 | 4.3%(-2.15)#16,056 |
| 29. | 55120 | 1.4% | 4.3%(-2.87)#546 | 4.3%(-2.84)#18,428 |
1
Common Questions
What are the Top 10 Zip Codes with the Highest Percentage of Population with a Degree in Visual and Performing Arts in Saint Paul, MN?
Top 10 Zip Codes with the Highest Percentage of Population with a Degree in Visual and Performing Arts in Saint Paul, MN are:
What zip code has the Highest Percentage of Population with a Degree in Visual and Performing Arts in Saint Paul, MN?
55114 has the Highest Percentage of Population with a Degree in Visual and Performing Arts in Saint Paul, MN with 13.7%.
What is the Percentage of Population with a Degree in Visual and Performing Arts in Minnesota?
Percentage of Population with a Degree in Visual and Performing Arts in Minnesota is 4.3%.
What is the Percentage of Population with a Degree in Visual and Performing Arts in the United States?
Percentage of Population with a Degree in Visual and Performing Arts in the United States is 4.3%.