Zip Codes with the Highest Percentage of Population Employed in Installation, Maintenance & Repair in Saint Paul, MN
RELATED REPORTS & OPTIONS
Installation, Maintenance & Repair
Saint Paul
Compare Zip Codes
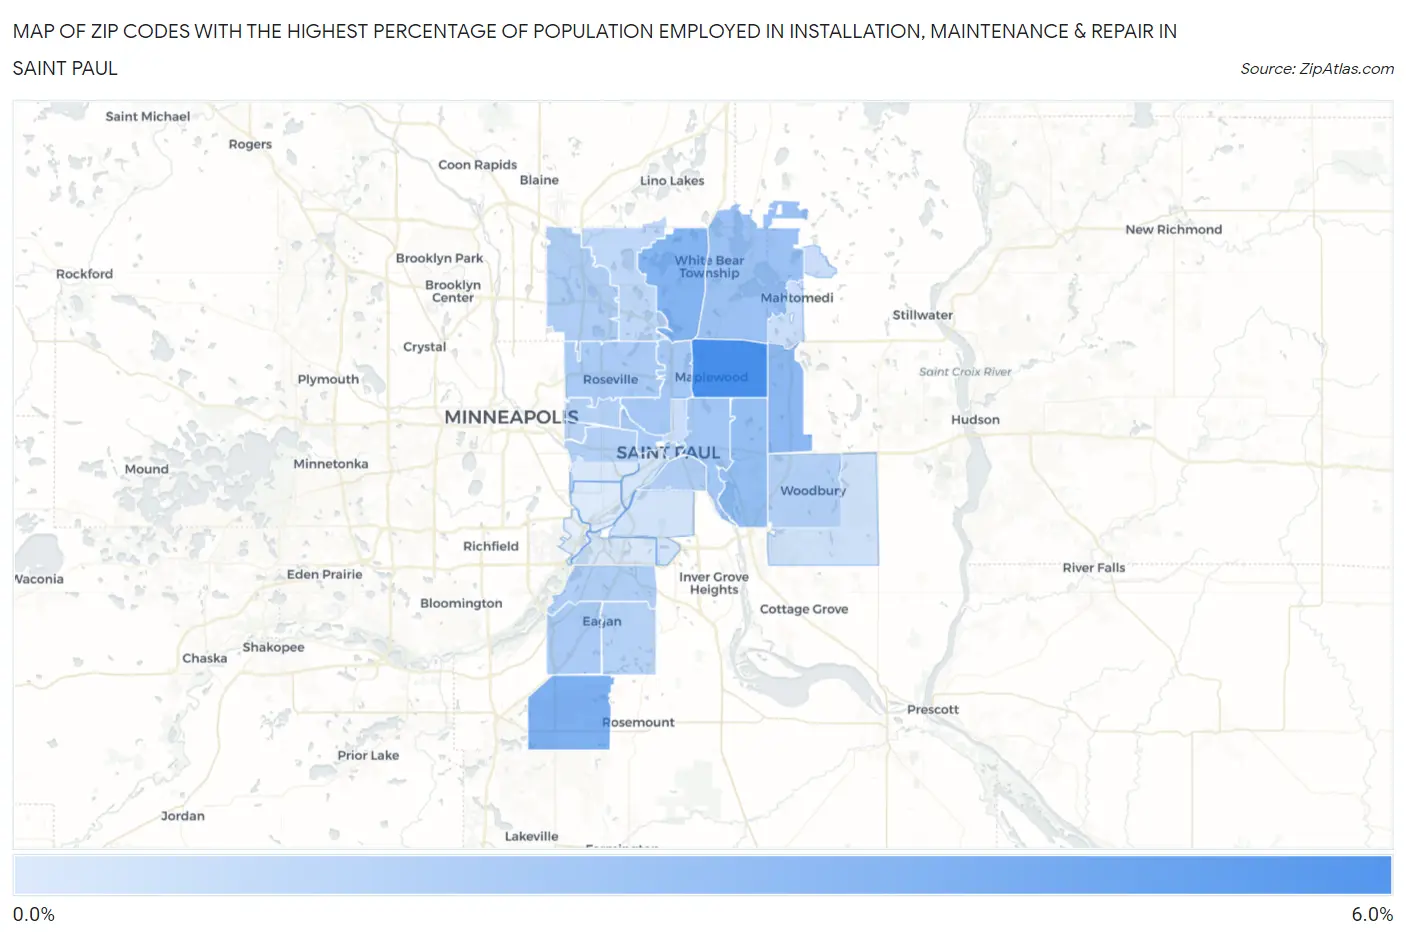
Map of Zip Codes with the Highest Percentage of Population Employed in Installation, Maintenance & Repair in Saint Paul
0.0%
6.0%
Zip Codes with the Highest Percentage of Population Employed in Installation, Maintenance & Repair in Saint Paul, MN
| Zip Code | % Employed | vs State | vs National | |
| 1. | 55109 | 5.0% | 2.9%(+2.14)#277 | 3.1%(+1.95)#8,658 |
| 2. | 55124 | 3.4% | 2.9%(+0.532)#475 | 3.1%(+0.340)#15,054 |
| 3. | 55127 | 3.3% | 2.9%(+0.413)#493 | 3.1%(+0.221)#15,602 |
| 4. | 55128 | 3.0% | 2.9%(+0.100)#550 | 3.1%(-0.091)#17,106 |
| 5. | 55119 | 2.8% | 2.9%(-0.121)#589 | 3.1%(-0.313)#18,239 |
| 6. | 55110 | 2.6% | 2.9%(-0.295)#611 | 3.1%(-0.486)#19,164 |
| 7. | 55106 | 2.3% | 2.9%(-0.570)#651 | 3.1%(-0.761)#20,538 |
| 8. | 55117 | 2.3% | 2.9%(-0.623)#655 | 3.1%(-0.815)#20,810 |
| 9. | 55113 | 2.2% | 2.9%(-0.722)#669 | 3.1%(-0.914)#21,291 |
| 10. | 55103 | 2.2% | 2.9%(-0.725)#670 | 3.1%(-0.917)#21,300 |
| 11. | 55122 | 2.1% | 2.9%(-0.734)#672 | 3.1%(-0.925)#21,338 |
| 12. | 55112 | 2.0% | 2.9%(-0.900)#692 | 3.1%(-1.09)#22,124 |
| 13. | 55107 | 1.9% | 2.9%(-0.971)#705 | 3.1%(-1.16)#22,448 |
| 14. | 55121 | 1.9% | 2.9%(-0.974)#706 | 3.1%(-1.17)#22,457 |
| 15. | 55101 | 1.9% | 2.9%(-0.984)#710 | 3.1%(-1.18)#22,499 |
| 16. | 55125 | 1.9% | 2.9%(-1.01)#712 | 3.1%(-1.20)#22,587 |
| 17. | 55104 | 1.8% | 2.9%(-1.05)#714 | 3.1%(-1.24)#22,756 |
| 18. | 55123 | 1.8% | 2.9%(-1.07)#716 | 3.1%(-1.26)#22,855 |
| 19. | 55108 | 1.8% | 2.9%(-1.10)#721 | 3.1%(-1.30)#23,025 |
| 20. | 55114 | 1.7% | 2.9%(-1.17)#731 | 3.1%(-1.37)#23,335 |
| 21. | 55126 | 1.5% | 2.9%(-1.34)#746 | 3.1%(-1.53)#24,029 |
| 22. | 55130 | 1.2% | 2.9%(-1.66)#767 | 3.1%(-1.85)#25,200 |
| 23. | 55115 | 1.2% | 2.9%(-1.70)#770 | 3.1%(-1.89)#25,335 |
| 24. | 55129 | 1.0% | 2.9%(-1.83)#783 | 3.1%(-2.02)#25,790 |
| 25. | 55118 | 1.0% | 2.9%(-1.85)#788 | 3.1%(-2.05)#25,875 |
| 26. | 55102 | 0.91% | 2.9%(-1.96)#796 | 3.1%(-2.15)#26,156 |
| 27. | 55120 | 0.80% | 2.9%(-2.07)#804 | 3.1%(-2.26)#26,481 |
| 28. | 55105 | 0.78% | 2.9%(-2.10)#806 | 3.1%(-2.29)#26,577 |
| 29. | 55116 | 0.67% | 2.9%(-2.21)#810 | 3.1%(-2.40)#26,859 |
1
Common Questions
What are the Top 10 Zip Codes with the Highest Percentage of Population Employed in Installation, Maintenance & Repair in Saint Paul, MN?
Top 10 Zip Codes with the Highest Percentage of Population Employed in Installation, Maintenance & Repair in Saint Paul, MN are:
What zip code has the Highest Percentage of Population Employed in Installation, Maintenance & Repair in Saint Paul, MN?
55109 has the Highest Percentage of Population Employed in Installation, Maintenance & Repair in Saint Paul, MN with 5.0%.
What is the Percentage of Population Employed in Installation, Maintenance & Repair in Minnesota?
Percentage of Population Employed in Installation, Maintenance & Repair in Minnesota is 2.9%.
What is the Percentage of Population Employed in Installation, Maintenance & Repair in the United States?
Percentage of Population Employed in Installation, Maintenance & Repair in the United States is 3.1%.