Zip Codes with the Highest Percentage of Population with a Degree in Liberal Arts and History in Saint Paul, MN
RELATED REPORTS & OPTIONS
Liberal Arts and History
Saint Paul
Compare Zip Codes
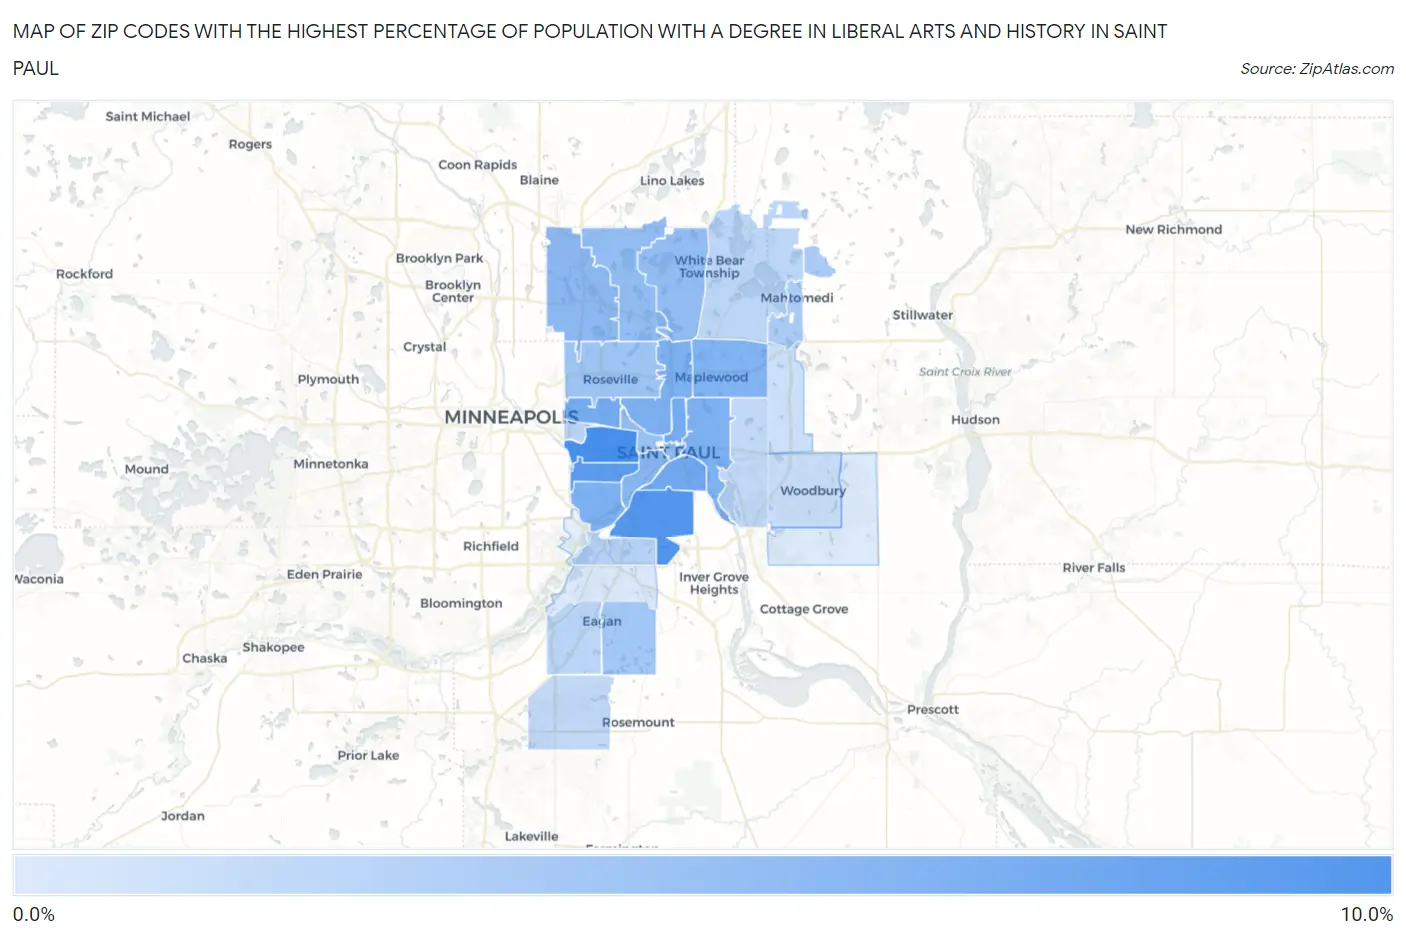
Map of Zip Codes with the Highest Percentage of Population with a Degree in Liberal Arts and History in Saint Paul
0.0%
10.0%
Zip Codes with the Highest Percentage of Population with a Degree in Liberal Arts and History in Saint Paul, MN
| Zip Code | % Graduates | vs State | vs National | |
| 1. | 55104 | 9.3% | 4.4%(+4.95)#46 | 4.9%(+4.45)#3,581 |
| 2. | 55118 | 8.7% | 4.4%(+4.35)#53 | 4.9%(+3.86)#4,097 |
| 3. | 55105 | 8.2% | 4.4%(+3.85)#62 | 4.9%(+3.35)#4,629 |
| 4. | 55107 | 7.2% | 4.4%(+2.85)#87 | 4.9%(+2.36)#6,004 |
| 5. | 55108 | 7.0% | 4.4%(+2.63)#92 | 4.9%(+2.13)#6,375 |
| 6. | 55130 | 7.0% | 4.4%(+2.59)#94 | 4.9%(+2.09)#6,452 |
| 7. | 55117 | 6.6% | 4.4%(+2.23)#112 | 4.9%(+1.73)#7,143 |
| 8. | 55106 | 6.6% | 4.4%(+2.19)#115 | 4.9%(+1.69)#7,218 |
| 9. | 55116 | 6.5% | 4.4%(+2.17)#116 | 4.9%(+1.68)#7,251 |
| 10. | 55109 | 6.4% | 4.4%(+2.04)#123 | 4.9%(+1.55)#7,526 |
| 11. | 55102 | 6.0% | 4.4%(+1.66)#147 | 4.9%(+1.16)#8,422 |
| 12. | 55112 | 5.9% | 4.4%(+1.49)#157 | 4.9%(+0.999)#8,867 |
| 13. | 55101 | 5.8% | 4.4%(+1.41)#163 | 4.9%(+0.911)#9,087 |
| 14. | 55127 | 5.5% | 4.4%(+1.14)#181 | 4.9%(+0.646)#9,825 |
| 15. | 55126 | 5.4% | 4.4%(+1.07)#185 | 4.9%(+0.577)#10,004 |
| 16. | 55103 | 5.3% | 4.4%(+0.921)#197 | 4.9%(+0.427)#10,449 |
| 17. | 55113 | 4.9% | 4.4%(+0.528)#234 | 4.9%(+0.033)#11,622 |
| 18. | 55123 | 4.7% | 4.4%(+0.302)#257 | 4.9%(-0.193)#12,395 |
| 19. | 55115 | 4.4% | 4.4%(-0.002)#305 | 4.9%(-0.496)#13,372 |
| 20. | 55120 | 3.7% | 4.4%(-0.628)#373 | 4.9%(-1.12)#15,708 |
| 21. | 55114 | 3.7% | 4.4%(-0.684)#383 | 4.9%(-1.18)#15,937 |
| 22. | 55122 | 3.6% | 4.4%(-0.784)#398 | 4.9%(-1.28)#16,270 |
| 23. | 55110 | 3.4% | 4.4%(-0.950)#414 | 4.9%(-1.44)#16,886 |
| 24. | 55119 | 3.3% | 4.4%(-1.13)#426 | 4.9%(-1.62)#17,474 |
| 25. | 55124 | 3.2% | 4.4%(-1.16)#434 | 4.9%(-1.66)#17,596 |
| 26. | 55125 | 2.9% | 4.4%(-1.50)#476 | 4.9%(-2.00)#18,763 |
| 27. | 55128 | 2.6% | 4.4%(-1.75)#511 | 4.9%(-2.25)#19,582 |
| 28. | 55121 | 2.0% | 4.4%(-2.34)#594 | 4.9%(-2.84)#21,291 |
| 29. | 55129 | 1.9% | 4.4%(-2.50)#619 | 4.9%(-2.99)#21,655 |
1
Common Questions
What are the Top 10 Zip Codes with the Highest Percentage of Population with a Degree in Liberal Arts and History in Saint Paul, MN?
Top 10 Zip Codes with the Highest Percentage of Population with a Degree in Liberal Arts and History in Saint Paul, MN are:
What zip code has the Highest Percentage of Population with a Degree in Liberal Arts and History in Saint Paul, MN?
55104 has the Highest Percentage of Population with a Degree in Liberal Arts and History in Saint Paul, MN with 9.3%.
What is the Percentage of Population with a Degree in Liberal Arts and History in Minnesota?
Percentage of Population with a Degree in Liberal Arts and History in Minnesota is 4.4%.
What is the Percentage of Population with a Degree in Liberal Arts and History in the United States?
Percentage of Population with a Degree in Liberal Arts and History in the United States is 4.9%.