Zip Codes with the Highest Percentage of Population Employed in Architecture & Engineering in Saint Paul, MN
RELATED REPORTS & OPTIONS
Architecture & Engineering
Saint Paul
Compare Zip Codes
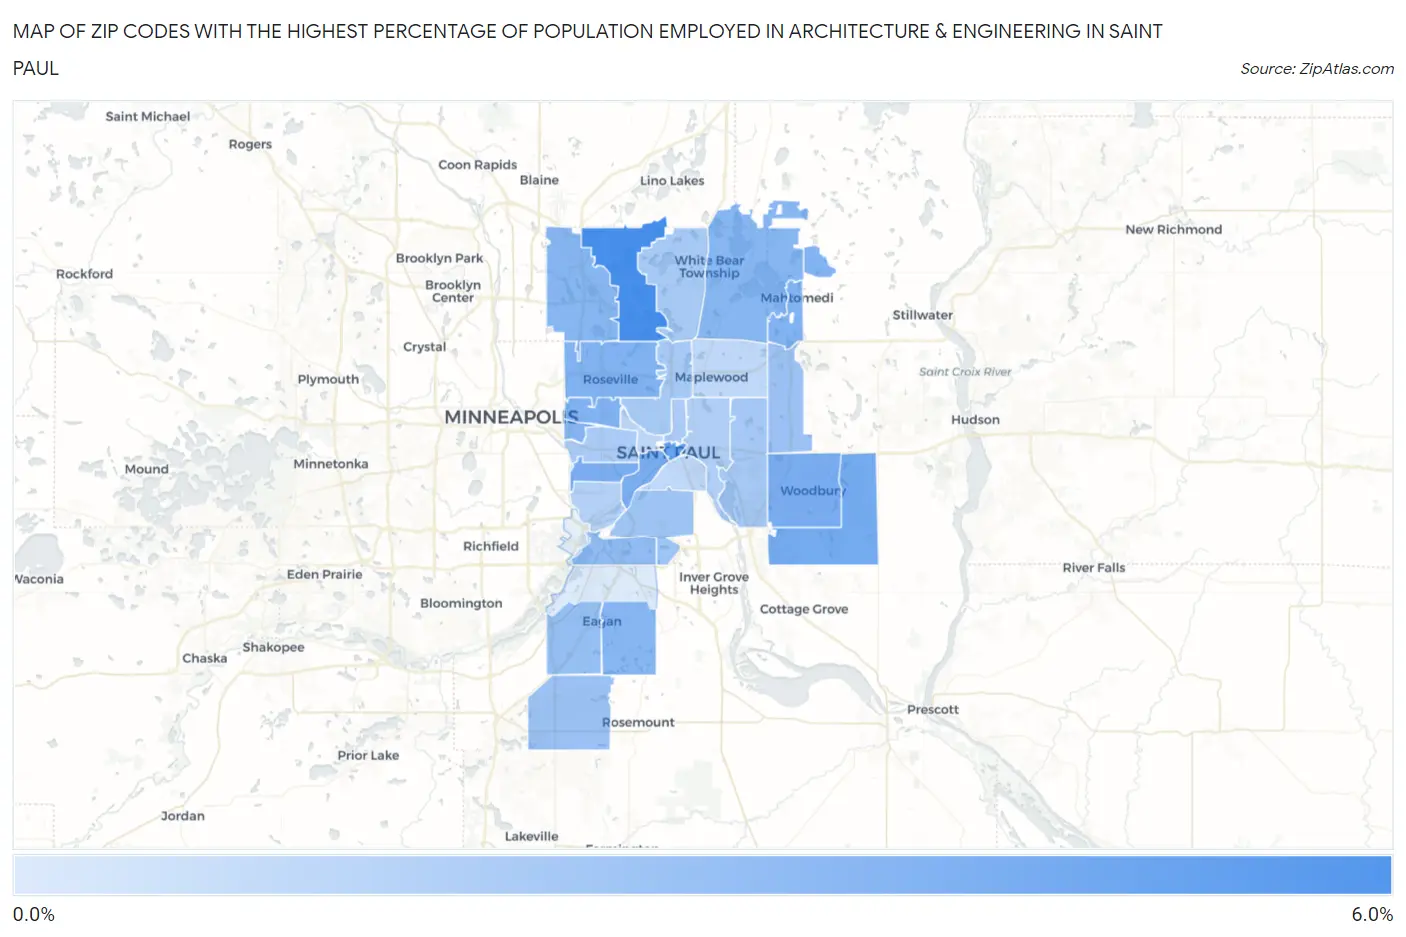
Map of Zip Codes with the Highest Percentage of Population Employed in Architecture & Engineering in Saint Paul
0.0%
6.0%
Zip Codes with the Highest Percentage of Population Employed in Architecture & Engineering in Saint Paul, MN
| Zip Code | % Employed | vs State | vs National | |
| 1. | 55126 | 5.3% | 2.4%(+2.89)#10 | 2.1%(+3.11)#1,480 |
| 2. | 55101 | 4.2% | 2.4%(+1.88)#42 | 2.1%(+2.10)#2,437 |
| 3. | 55129 | 3.7% | 2.4%(+1.37)#58 | 2.1%(+1.59)#3,224 |
| 4. | 55125 | 3.6% | 2.4%(+1.21)#67 | 2.1%(+1.43)#3,558 |
| 5. | 55105 | 3.6% | 2.4%(+1.20)#68 | 2.1%(+1.42)#3,563 |
| 6. | 55102 | 3.6% | 2.4%(+1.20)#70 | 2.1%(+1.41)#3,581 |
| 7. | 55108 | 3.4% | 2.4%(+0.986)#85 | 2.1%(+1.20)#4,059 |
| 8. | 55115 | 3.3% | 2.4%(+0.933)#88 | 2.1%(+1.15)#4,192 |
| 9. | 55113 | 3.3% | 2.4%(+0.931)#89 | 2.1%(+1.15)#4,196 |
| 10. | 55114 | 3.2% | 2.4%(+0.837)#98 | 2.1%(+1.06)#4,449 |
| 11. | 55123 | 3.1% | 2.4%(+0.761)#102 | 2.1%(+0.980)#4,655 |
| 12. | 55112 | 3.1% | 2.4%(+0.757)#103 | 2.1%(+0.976)#4,674 |
| 13. | 55110 | 3.1% | 2.4%(+0.735)#105 | 2.1%(+0.954)#4,737 |
| 14. | 55120 | 2.8% | 2.4%(+0.431)#141 | 2.1%(+0.650)#5,795 |
| 15. | 55122 | 2.7% | 2.4%(+0.297)#157 | 2.1%(+0.516)#6,310 |
| 16. | 55128 | 2.5% | 2.4%(+0.151)#177 | 2.1%(+0.370)#6,916 |
| 17. | 55124 | 2.5% | 2.4%(+0.136)#180 | 2.1%(+0.355)#6,979 |
| 18. | 55118 | 2.3% | 2.4%(-0.051)#212 | 2.1%(+0.168)#7,864 |
| 19. | 55119 | 2.1% | 2.4%(-0.292)#259 | 2.1%(-0.073)#9,169 |
| 20. | 55127 | 2.1% | 2.4%(-0.307)#262 | 2.1%(-0.088)#9,253 |
| 21. | 55117 | 2.0% | 2.4%(-0.321)#265 | 2.1%(-0.102)#9,328 |
| 22. | 55130 | 2.0% | 2.4%(-0.379)#289 | 2.1%(-0.160)#9,676 |
| 23. | 55104 | 1.9% | 2.4%(-0.429)#301 | 2.1%(-0.210)#9,985 |
| 24. | 55106 | 1.7% | 2.4%(-0.623)#342 | 2.1%(-0.404)#11,195 |
| 25. | 55116 | 1.7% | 2.4%(-0.684)#355 | 2.1%(-0.465)#11,605 |
| 26. | 55103 | 1.3% | 2.4%(-1.07)#452 | 2.1%(-0.856)#14,350 |
| 27. | 55109 | 1.3% | 2.4%(-1.08)#456 | 2.1%(-0.864)#14,409 |
| 28. | 55107 | 1.3% | 2.4%(-1.10)#458 | 2.1%(-0.880)#14,531 |
| 29. | 55121 | 0.30% | 2.4%(-2.06)#700 | 2.1%(-1.84)#21,527 |
1
Common Questions
What are the Top 10 Zip Codes with the Highest Percentage of Population Employed in Architecture & Engineering in Saint Paul, MN?
Top 10 Zip Codes with the Highest Percentage of Population Employed in Architecture & Engineering in Saint Paul, MN are:
What zip code has the Highest Percentage of Population Employed in Architecture & Engineering in Saint Paul, MN?
55126 has the Highest Percentage of Population Employed in Architecture & Engineering in Saint Paul, MN with 5.3%.
What is the Percentage of Population Employed in Architecture & Engineering in Minnesota?
Percentage of Population Employed in Architecture & Engineering in Minnesota is 2.4%.
What is the Percentage of Population Employed in Architecture & Engineering in the United States?
Percentage of Population Employed in Architecture & Engineering in the United States is 2.1%.