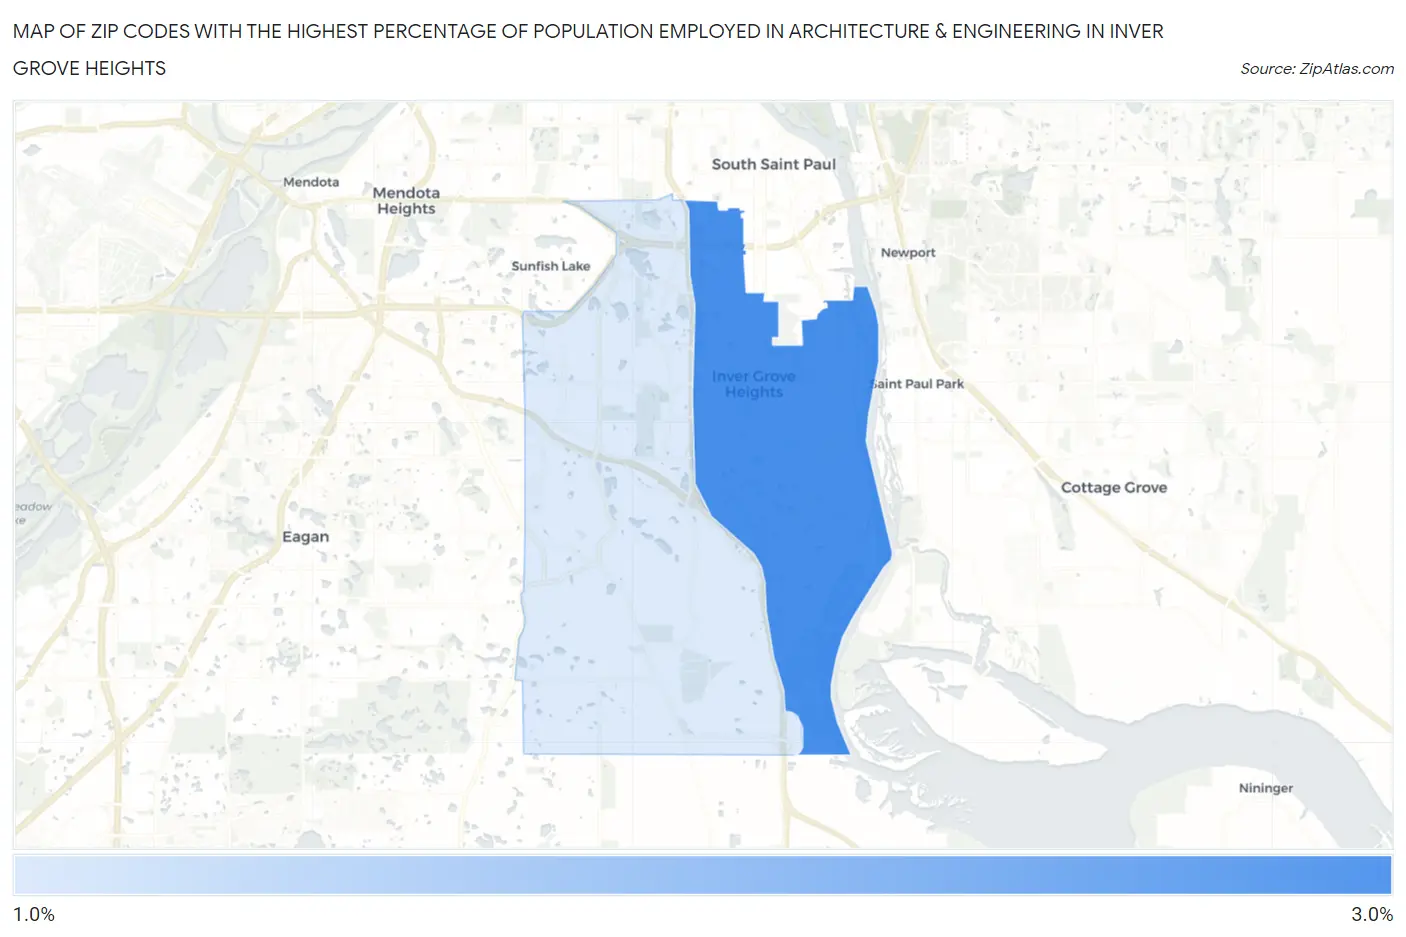
Zip Codes with the Highest Percentage of Population Employed in Architecture & Engineering in Inver Grove Heights, MN
RELATED REPORTS & OPTIONS
Architecture & Engineering
Inver Grove Heights
Compare Zip Codes
Map of Zip Codes with the Highest Percentage of Population Employed in Architecture & Engineering in Inver Grove Heights
0.0%
3.0%
Zip Codes with the Highest Percentage of Population Employed in Architecture & Engineering in Inver Grove Heights, MN
| Zip Code | % Employed | vs State | vs National | |
| 1. | 55076 | 2.8% | 2.4%(+0.437)#139 | 2.1%(+0.656)#5,769 |
| 2. | 55077 | 1.6% | 2.4%(-0.744)#365 | 2.1%(-0.525)#12,015 |
1
Common Questions
What are the Top Zip Codes with the Highest Percentage of Population Employed in Architecture & Engineering in Inver Grove Heights, MN?
Top Zip Codes with the Highest Percentage of Population Employed in Architecture & Engineering in Inver Grove Heights, MN are:
What zip code has the Highest Percentage of Population Employed in Architecture & Engineering in Inver Grove Heights, MN?
55076 has the Highest Percentage of Population Employed in Architecture & Engineering in Inver Grove Heights, MN with 2.8%.
What is the Percentage of Population Employed in Architecture & Engineering in Inver Grove Heights, MN?
Percentage of Population Employed in Architecture & Engineering in Inver Grove Heights is 2.3%.
What is the Percentage of Population Employed in Architecture & Engineering in Minnesota?
Percentage of Population Employed in Architecture & Engineering in Minnesota is 2.4%.
What is the Percentage of Population Employed in Architecture & Engineering in the United States?
Percentage of Population Employed in Architecture & Engineering in the United States is 2.1%.