Zip Codes with the Highest Percentage of Population with a Degree in Science and Engineering in Clinton Township, MI
RELATED REPORTS & OPTIONS
Science and Engineering
Clinton Township
Compare Zip Codes
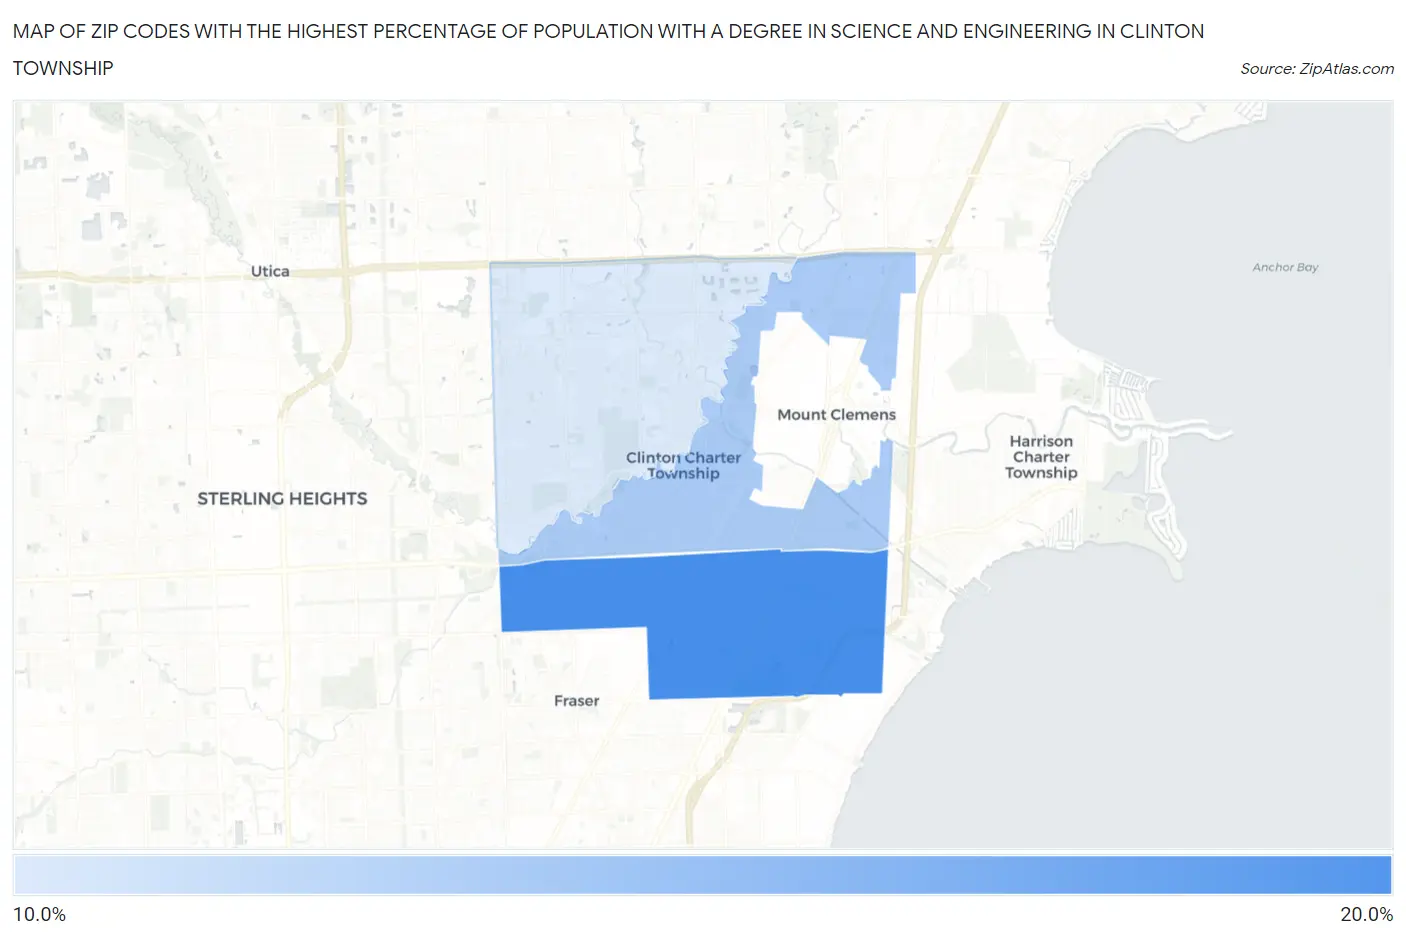
Map of Zip Codes with the Highest Percentage of Population with a Degree in Science and Engineering in Clinton Township
0.0%
20.0%
Zip Codes with the Highest Percentage of Population with a Degree in Science and Engineering in Clinton Township, MI
| Zip Code | % Graduates | vs State | vs National | |
| 1. | 48035 | 18.1% | 11.2%(+6.96)#122 | 9.8%(+8.35)#4,245 |
| 2. | 48036 | 14.6% | 11.2%(+3.42)#236 | 9.8%(+4.80)#7,140 |
| 3. | 48038 | 12.8% | 11.2%(+1.66)#344 | 9.8%(+3.04)#9,508 |
1
Common Questions
What are the Top Zip Codes with the Highest Percentage of Population with a Degree in Science and Engineering in Clinton Township, MI?
Top Zip Codes with the Highest Percentage of Population with a Degree in Science and Engineering in Clinton Township, MI are:
What zip code has the Highest Percentage of Population with a Degree in Science and Engineering in Clinton Township, MI?
48035 has the Highest Percentage of Population with a Degree in Science and Engineering in Clinton Township, MI with 18.1%.
What is the Percentage of Population with a Degree in Science and Engineering in Michigan?
Percentage of Population with a Degree in Science and Engineering in Michigan is 11.2%.
What is the Percentage of Population with a Degree in Science and Engineering in the United States?
Percentage of Population with a Degree in Science and Engineering in the United States is 9.8%.