Zip Codes with the Highest Percentage of Population Employed in Life, Physical & Social Science in East Lansing, MI
RELATED REPORTS & OPTIONS
Life, Physical & Social Science
East Lansing
Compare Zip Codes
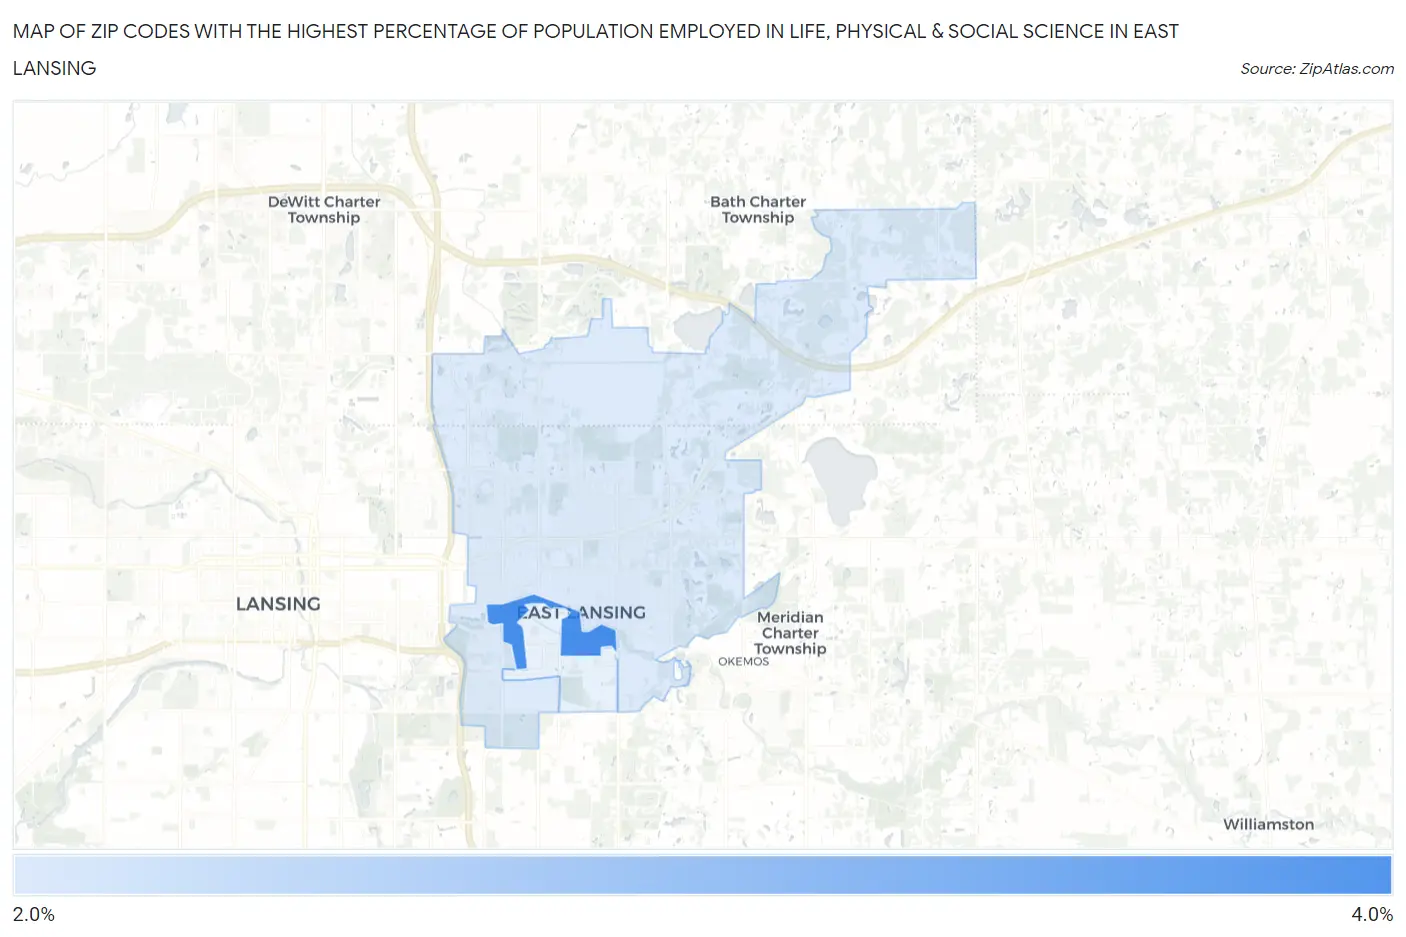
Map of Zip Codes with the Highest Percentage of Population Employed in Life, Physical & Social Science in East Lansing
0.0%
4.0%
Zip Codes with the Highest Percentage of Population Employed in Life, Physical & Social Science in East Lansing, MI
| Zip Code | % Employed | vs State | vs National | |
| 1. | 48825 | 3.7% | 0.88%(+2.82)#18 | 1.1%(+2.61)#1,317 |
| 2. | 48823 | 2.7% | 0.88%(+1.84)#32 | 1.1%(+1.63)#2,221 |
1
Common Questions
What are the Top Zip Codes with the Highest Percentage of Population Employed in Life, Physical & Social Science in East Lansing, MI?
Top Zip Codes with the Highest Percentage of Population Employed in Life, Physical & Social Science in East Lansing, MI are:
What zip code has the Highest Percentage of Population Employed in Life, Physical & Social Science in East Lansing, MI?
48825 has the Highest Percentage of Population Employed in Life, Physical & Social Science in East Lansing, MI with 3.7%.
What is the Percentage of Population Employed in Life, Physical & Social Science in East Lansing, MI?
Percentage of Population Employed in Life, Physical & Social Science in East Lansing is 2.8%.
What is the Percentage of Population Employed in Life, Physical & Social Science in Michigan?
Percentage of Population Employed in Life, Physical & Social Science in Michigan is 0.88%.
What is the Percentage of Population Employed in Life, Physical & Social Science in the United States?
Percentage of Population Employed in Life, Physical & Social Science in the United States is 1.1%.