Zip Codes with the Highest Percentage of Population Employed in Installation, Maintenance & Repair in Milford, MI
RELATED REPORTS & OPTIONS
Installation, Maintenance & Repair
Milford
Compare Zip Codes
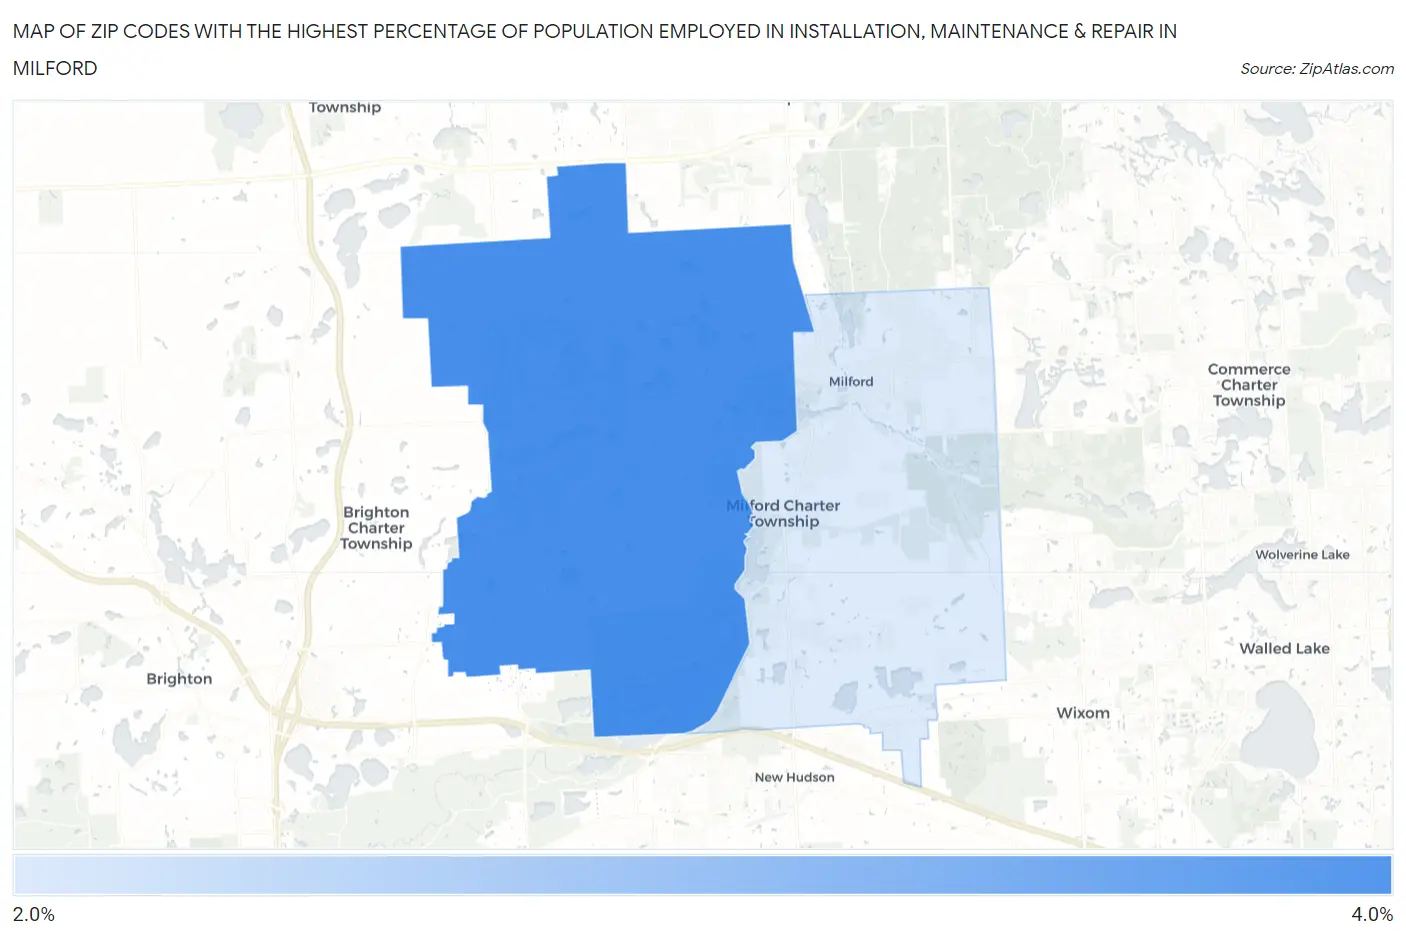
Map of Zip Codes with the Highest Percentage of Population Employed in Installation, Maintenance & Repair in Milford
0.0%
4.0%
Zip Codes with the Highest Percentage of Population Employed in Installation, Maintenance & Repair in Milford, MI
| Zip Code | % Employed | vs State | vs National | |
| 1. | 48380 | 3.0% | 3.1%(-0.099)#612 | 3.1%(-0.067)#16,970 |
| 2. | 48381 | 2.6% | 3.1%(-0.528)#678 | 3.1%(-0.496)#19,218 |
1
Common Questions
What are the Top Zip Codes with the Highest Percentage of Population Employed in Installation, Maintenance & Repair in Milford, MI?
Top Zip Codes with the Highest Percentage of Population Employed in Installation, Maintenance & Repair in Milford, MI are:
What zip code has the Highest Percentage of Population Employed in Installation, Maintenance & Repair in Milford, MI?
48380 has the Highest Percentage of Population Employed in Installation, Maintenance & Repair in Milford, MI with 3.0%.
What is the Percentage of Population Employed in Installation, Maintenance & Repair in Milford, MI?
Percentage of Population Employed in Installation, Maintenance & Repair in Milford is 1.4%.
What is the Percentage of Population Employed in Installation, Maintenance & Repair in Michigan?
Percentage of Population Employed in Installation, Maintenance & Repair in Michigan is 3.1%.
What is the Percentage of Population Employed in Installation, Maintenance & Repair in the United States?
Percentage of Population Employed in Installation, Maintenance & Repair in the United States is 3.1%.