Zip Codes with the Highest Percentage of Households Without a Vehicle in New Baltimore, MI
RELATED REPORTS & OPTIONS
Households without a Cars
New Baltimore
Compare Zip Codes
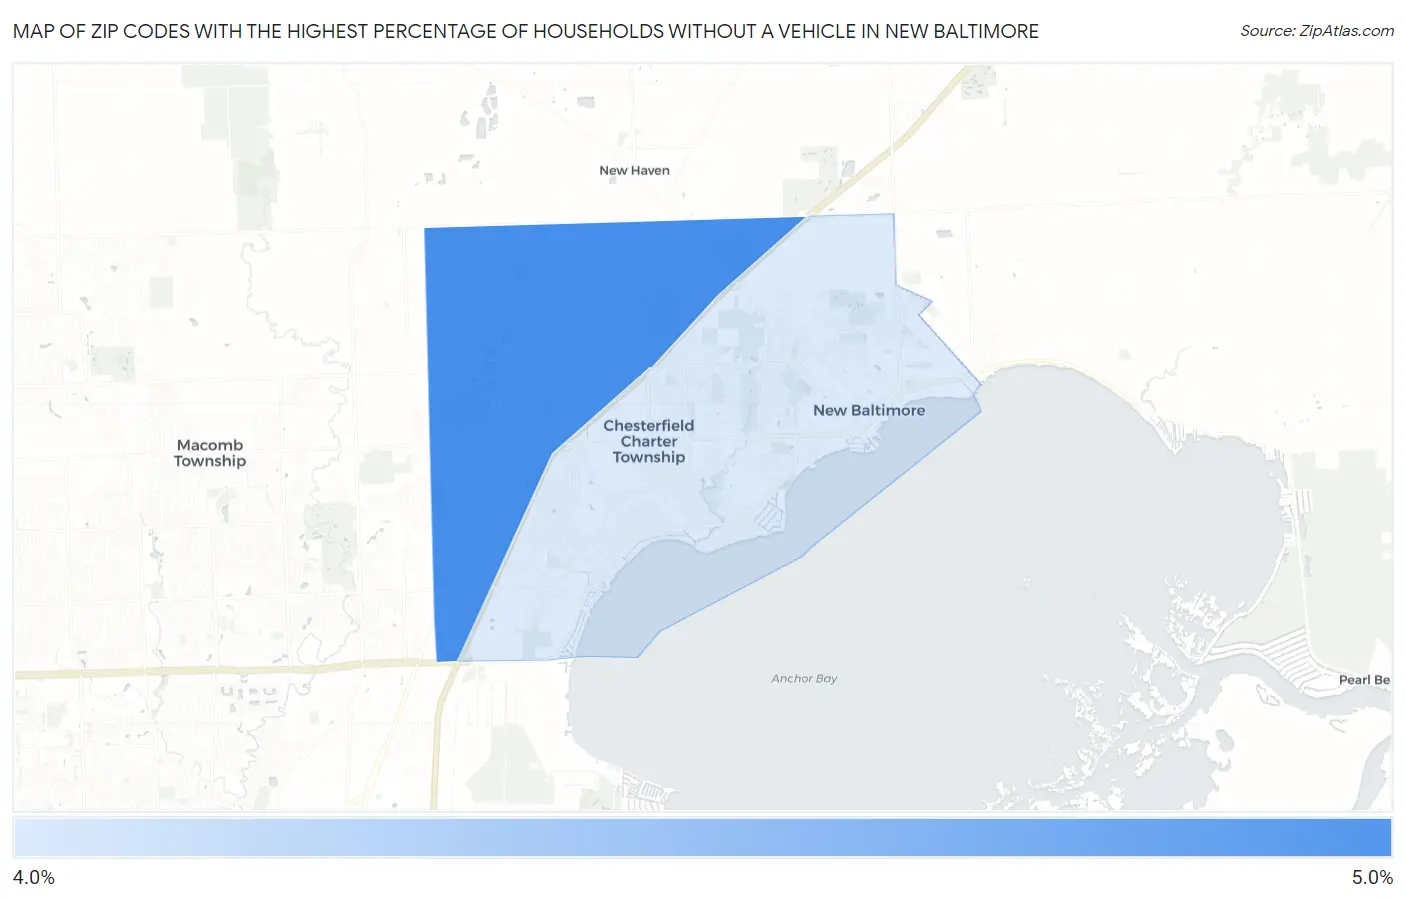
Map of Zip Codes with the Highest Percentage of Households Without a Vehicle in New Baltimore
0.0%
5.0%
Zip Codes with the Highest Percentage of Households Without a Vehicle in New Baltimore, MI
| Zip Code | Housholds Without a Car | vs State | vs National | |
| 1. | 48051 | 4.8% | 7.2%(-2.40)#436 | 8.3%(-3.50)#13,405 |
| 2. | 48047 | 4.1% | 7.2%(-3.10)#522 | 8.3%(-4.20)#15,371 |
1
Common Questions
What are the Top Zip Codes with the Highest Percentage of Households Without a Vehicle in New Baltimore, MI?
Top Zip Codes with the Highest Percentage of Households Without a Vehicle in New Baltimore, MI are:
What zip code has the Highest Percentage of Households Without a Vehicle in New Baltimore, MI?
48051 has the Highest Percentage of Households Without a Vehicle in New Baltimore, MI with 4.8%.
What is the Percentage of Households Without a Vehicle in New Baltimore, MI?
Percentage of Households Without a Vehicle in New Baltimore is 6.8%.
What is the Percentage of Households Without a Vehicle in Michigan?
Percentage of Households Without a Vehicle in Michigan is 7.2%.
What is the Percentage of Households Without a Vehicle in the United States?
Percentage of Households Without a Vehicle in the United States is 8.3%.