Zip Codes with the Highest Percentage of Not-for-profit Organizations in Northampton, MA
RELATED REPORTS & OPTIONS
Not-for-profit Organizations
Northampton
Compare Zip Codes
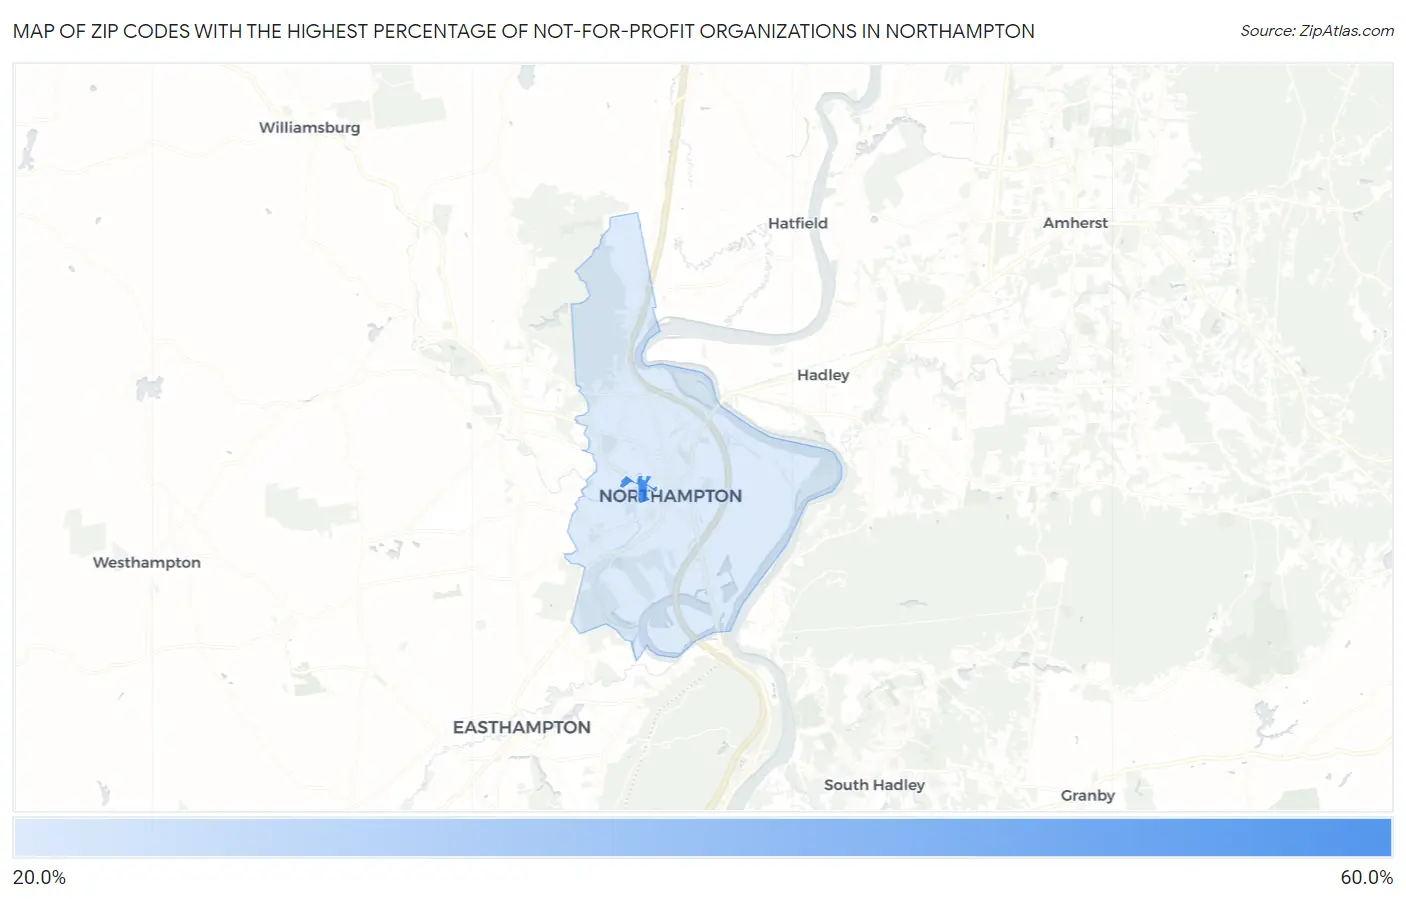
Map of Zip Codes with the Highest Percentage of Not-for-profit Organizations in Northampton
0.0%
60.0%
Zip Codes with the Highest Percentage of Not-for-profit Organizations in Northampton, MA
| Zip Code | % Employed in Not-for-profit | vs State | vs National | |
| 1. | 01063 | 52.1% | 13.4%(+38.8)#5 | 8.4%(+43.7)#118 |
| 2. | 01060 | 23.3% | 13.4%(+9.96)#36 | 8.4%(+14.9)#844 |
1
Common Questions
What are the Top Zip Codes with the Highest Percentage of Not-for-profit Organizations in Northampton, MA?
Top Zip Codes with the Highest Percentage of Not-for-profit Organizations in Northampton, MA are:
What zip code has the Highest Percentage of Not-for-profit Organizations in Northampton, MA?
01063 has the Highest Percentage of Not-for-profit Organizations in Northampton, MA with 52.1%.
What is the Percentage of Not-for-profit Organizations in Northampton, MA?
Percentage of Not-for-profit Organizations in Northampton is 23.8%.
What is the Percentage of Not-for-profit Organizations in Massachusetts?
Percentage of Not-for-profit Organizations in Massachusetts is 13.4%.
What is the Percentage of Not-for-profit Organizations in the United States?
Percentage of Not-for-profit Organizations in the United States is 8.4%.