Zip Codes with the Highest Percentage of Population Employed in Accommodation & Food Services in New Bedford, MA
RELATED REPORTS & OPTIONS
Accommodation & Food Services
New Bedford
Compare Zip Codes
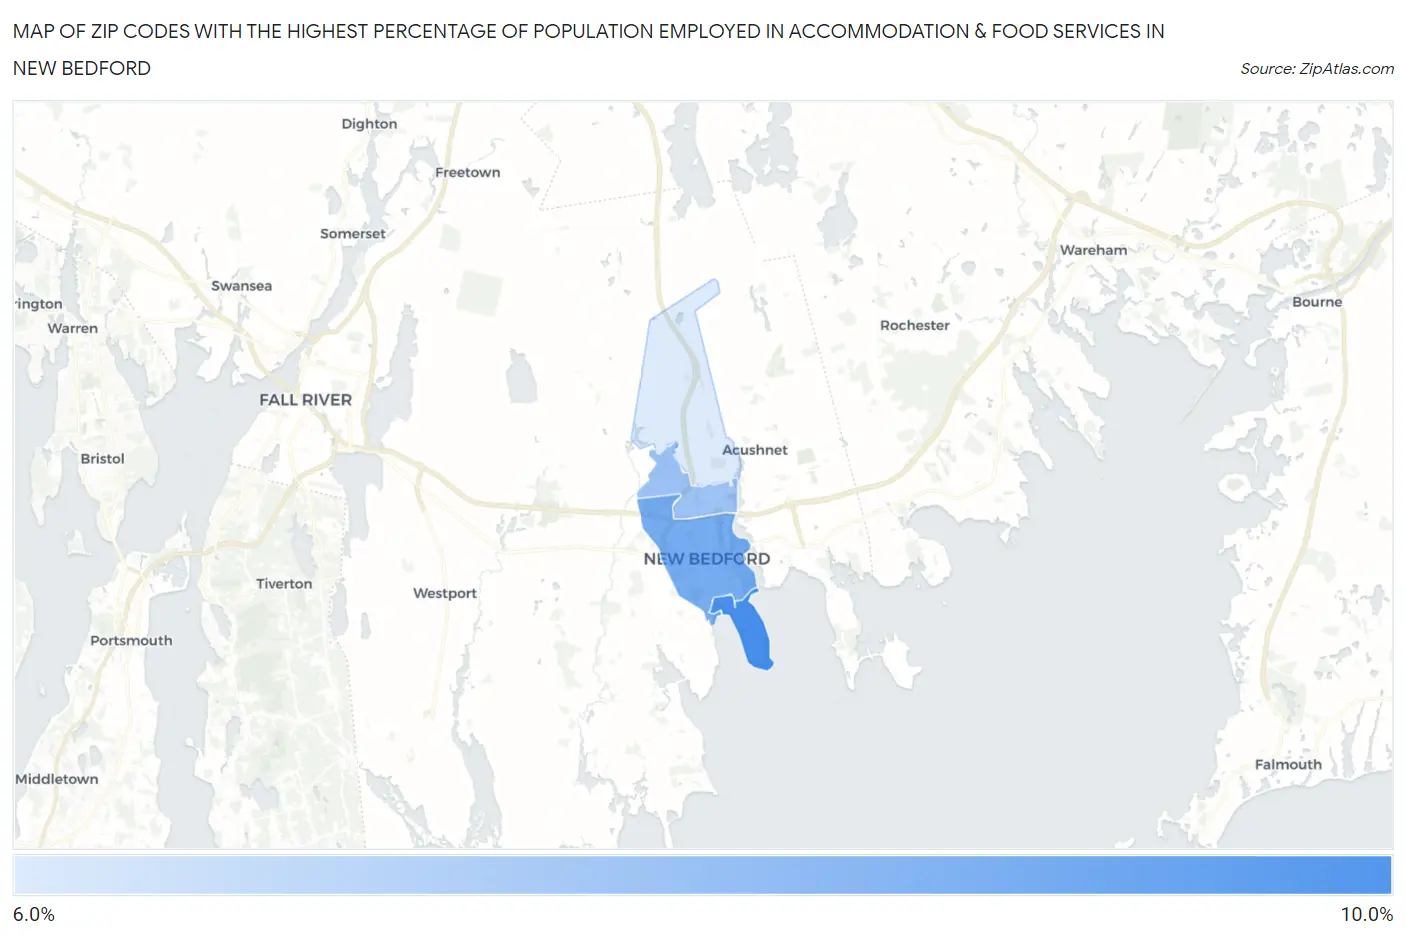
Map of Zip Codes with the Highest Percentage of Population Employed in Accommodation & Food Services in New Bedford
0.0%
10.0%
Zip Codes with the Highest Percentage of Population Employed in Accommodation & Food Services in New Bedford, MA
| Zip Code | % Employed | vs State | vs National | |
| 1. | 02744 | 9.6% | 5.8%(+3.84)#51 | 6.9%(+2.72)#5,064 |
| 2. | 02740 | 8.5% | 5.8%(+2.79)#72 | 6.9%(+1.67)#6,732 |
| 3. | 02746 | 7.7% | 5.8%(+1.93)#103 | 6.9%(+0.815)#8,504 |
| 4. | 02745 | 6.2% | 5.8%(+0.470)#176 | 6.9%(-0.649)#12,695 |
1
Common Questions
What are the Top 3 Zip Codes with the Highest Percentage of Population Employed in Accommodation & Food Services in New Bedford, MA?
Top 3 Zip Codes with the Highest Percentage of Population Employed in Accommodation & Food Services in New Bedford, MA are:
What zip code has the Highest Percentage of Population Employed in Accommodation & Food Services in New Bedford, MA?
02744 has the Highest Percentage of Population Employed in Accommodation & Food Services in New Bedford, MA with 9.6%.
What is the Percentage of Population Employed in Accommodation & Food Services in New Bedford, MA?
Percentage of Population Employed in Accommodation & Food Services in New Bedford is 7.9%.
What is the Percentage of Population Employed in Accommodation & Food Services in Massachusetts?
Percentage of Population Employed in Accommodation & Food Services in Massachusetts is 5.8%.
What is the Percentage of Population Employed in Accommodation & Food Services in the United States?
Percentage of Population Employed in Accommodation & Food Services in the United States is 6.9%.