Zip Codes with the Highest Percentage of Population Employed in Legal Services & Support in Lowell, MA
RELATED REPORTS & OPTIONS
Legal Services & Support
Lowell
Compare Zip Codes
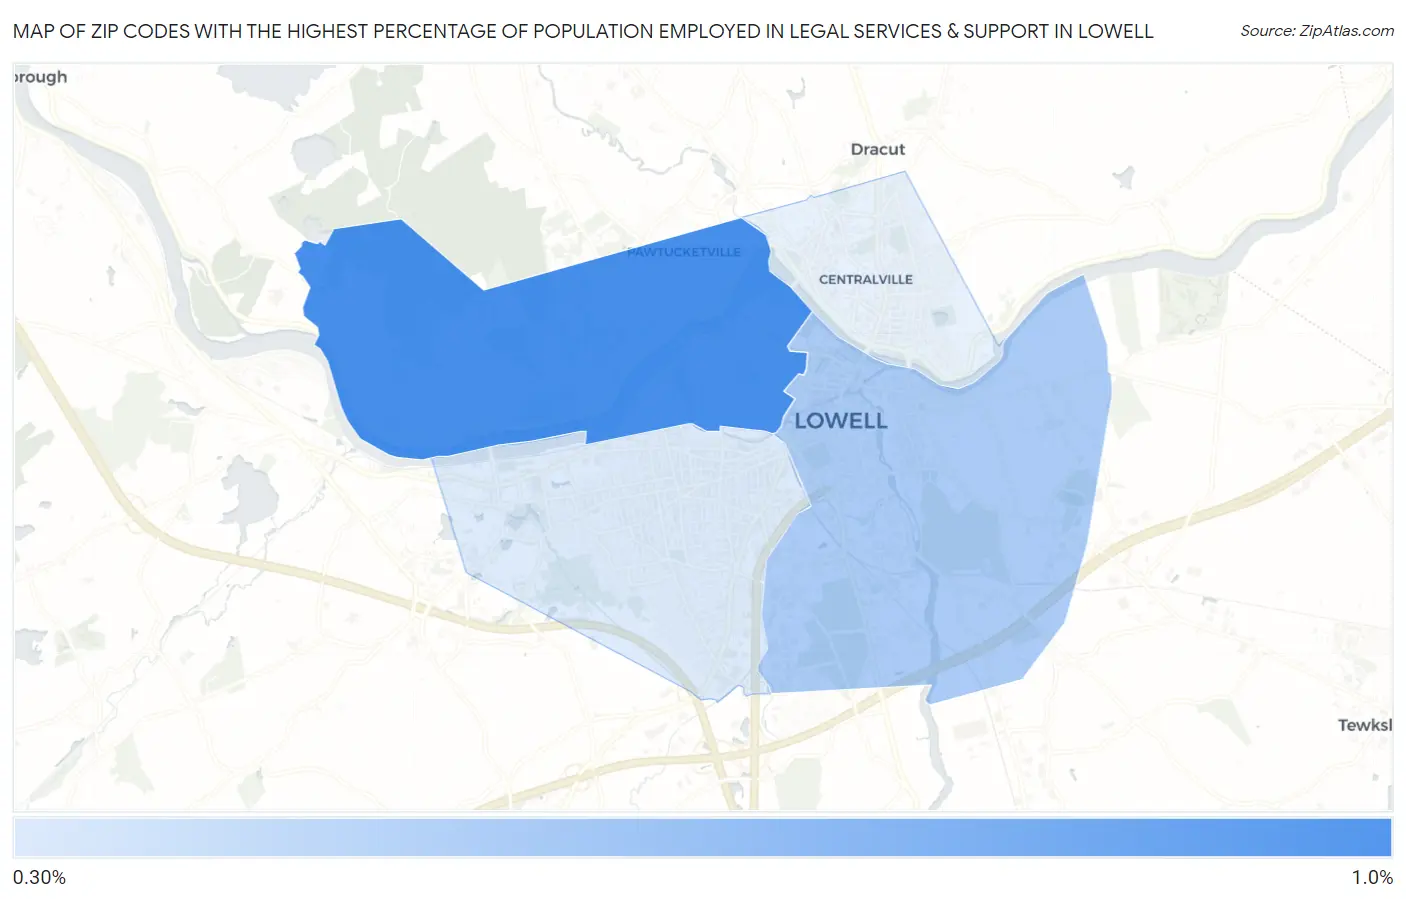
Map of Zip Codes with the Highest Percentage of Population Employed in Legal Services & Support in Lowell
0.0%
1.0%
Zip Codes with the Highest Percentage of Population Employed in Legal Services & Support in Lowell, MA
| Zip Code | % Employed | vs State | vs National | |
| 1. | 01854 | 0.93% | 1.5%(-0.559)#279 | 1.2%(-0.254)#8,351 |
| 2. | 01852 | 0.57% | 1.5%(-0.919)#342 | 1.2%(-0.615)#11,833 |
| 3. | 01851 | 0.38% | 1.5%(-1.11)#386 | 1.2%(-0.803)#14,080 |
1
Common Questions
What are the Top 3 Zip Codes with the Highest Percentage of Population Employed in Legal Services & Support in Lowell, MA?
Top 3 Zip Codes with the Highest Percentage of Population Employed in Legal Services & Support in Lowell, MA are:
What zip code has the Highest Percentage of Population Employed in Legal Services & Support in Lowell, MA?
01854 has the Highest Percentage of Population Employed in Legal Services & Support in Lowell, MA with 0.93%.
What is the Percentage of Population Employed in Legal Services & Support in Lowell, MA?
Percentage of Population Employed in Legal Services & Support in Lowell is 0.53%.
What is the Percentage of Population Employed in Legal Services & Support in Massachusetts?
Percentage of Population Employed in Legal Services & Support in Massachusetts is 1.5%.
What is the Percentage of Population Employed in Legal Services & Support in the United States?
Percentage of Population Employed in Legal Services & Support in the United States is 1.2%.