Zip Codes with the Highest Percentage of Population Employed in Security & Protection in Chicopee, MA
RELATED REPORTS & OPTIONS
Security & Protection
Chicopee
Compare Zip Codes
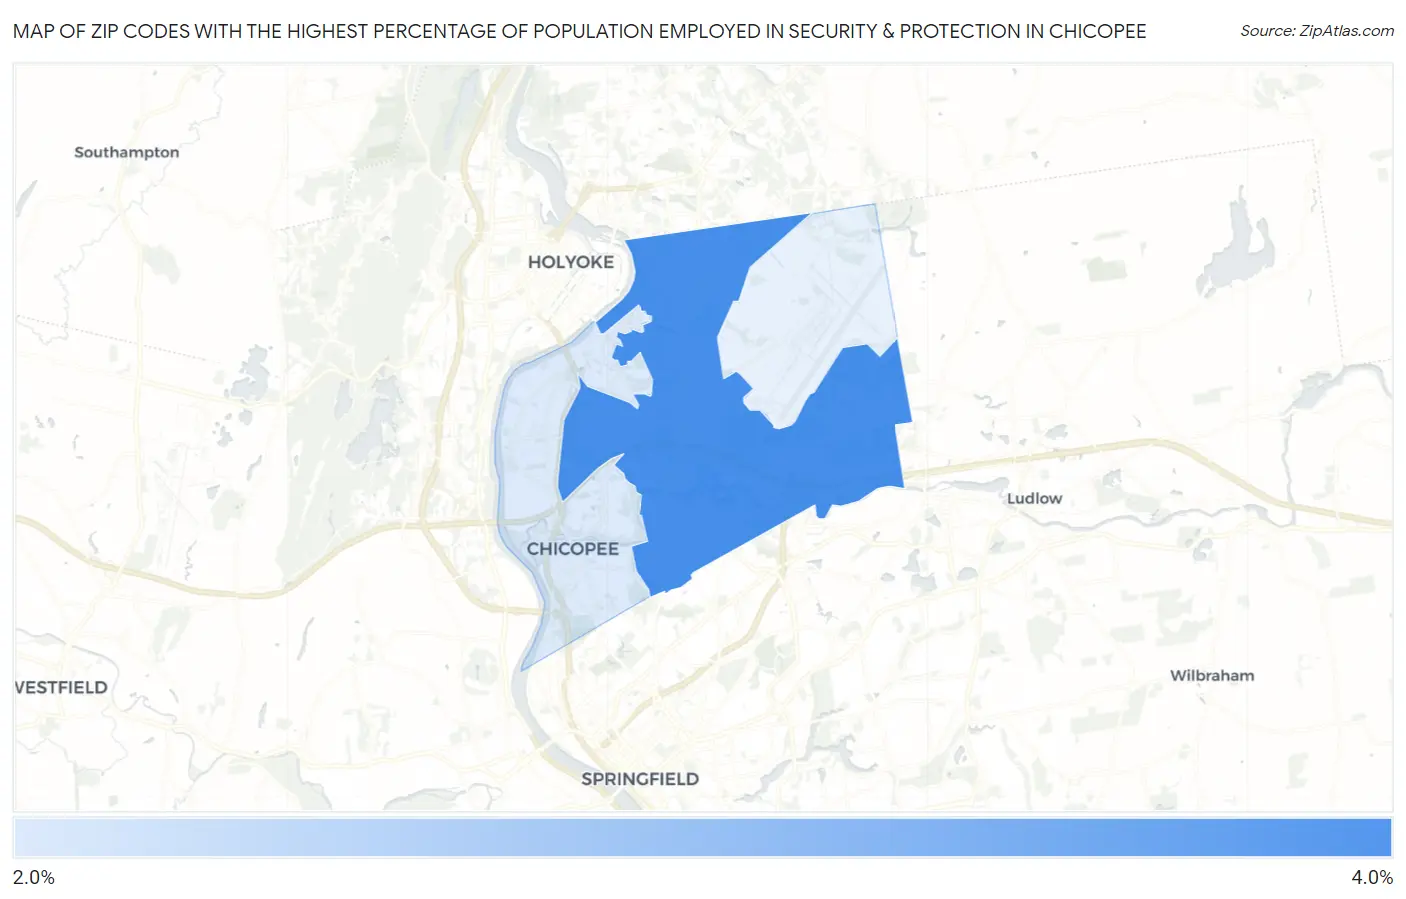
Map of Zip Codes with the Highest Percentage of Population Employed in Security & Protection in Chicopee
0.0%
4.0%
Zip Codes with the Highest Percentage of Population Employed in Security & Protection in Chicopee, MA
| Zip Code | % Employed | vs State | vs National | |
| 1. | 01020 | 3.9% | 2.0%(+1.87)#42 | 2.1%(+1.73)#4,728 |
| 2. | 01013 | 2.5% | 2.0%(+0.452)#151 | 2.1%(+0.318)#9,692 |
1
Common Questions
What are the Top Zip Codes with the Highest Percentage of Population Employed in Security & Protection in Chicopee, MA?
Top Zip Codes with the Highest Percentage of Population Employed in Security & Protection in Chicopee, MA are:
What zip code has the Highest Percentage of Population Employed in Security & Protection in Chicopee, MA?
01020 has the Highest Percentage of Population Employed in Security & Protection in Chicopee, MA with 3.9%.
What is the Percentage of Population Employed in Security & Protection in Chicopee, MA?
Percentage of Population Employed in Security & Protection in Chicopee is 3.2%.
What is the Percentage of Population Employed in Security & Protection in Massachusetts?
Percentage of Population Employed in Security & Protection in Massachusetts is 2.0%.
What is the Percentage of Population Employed in Security & Protection in the United States?
Percentage of Population Employed in Security & Protection in the United States is 2.1%.