Zip Codes with the Highest Percentage of Population Employed in Accommodation & Food Services in Quincy, MA
RELATED REPORTS & OPTIONS
Accommodation & Food Services
Quincy
Compare Zip Codes
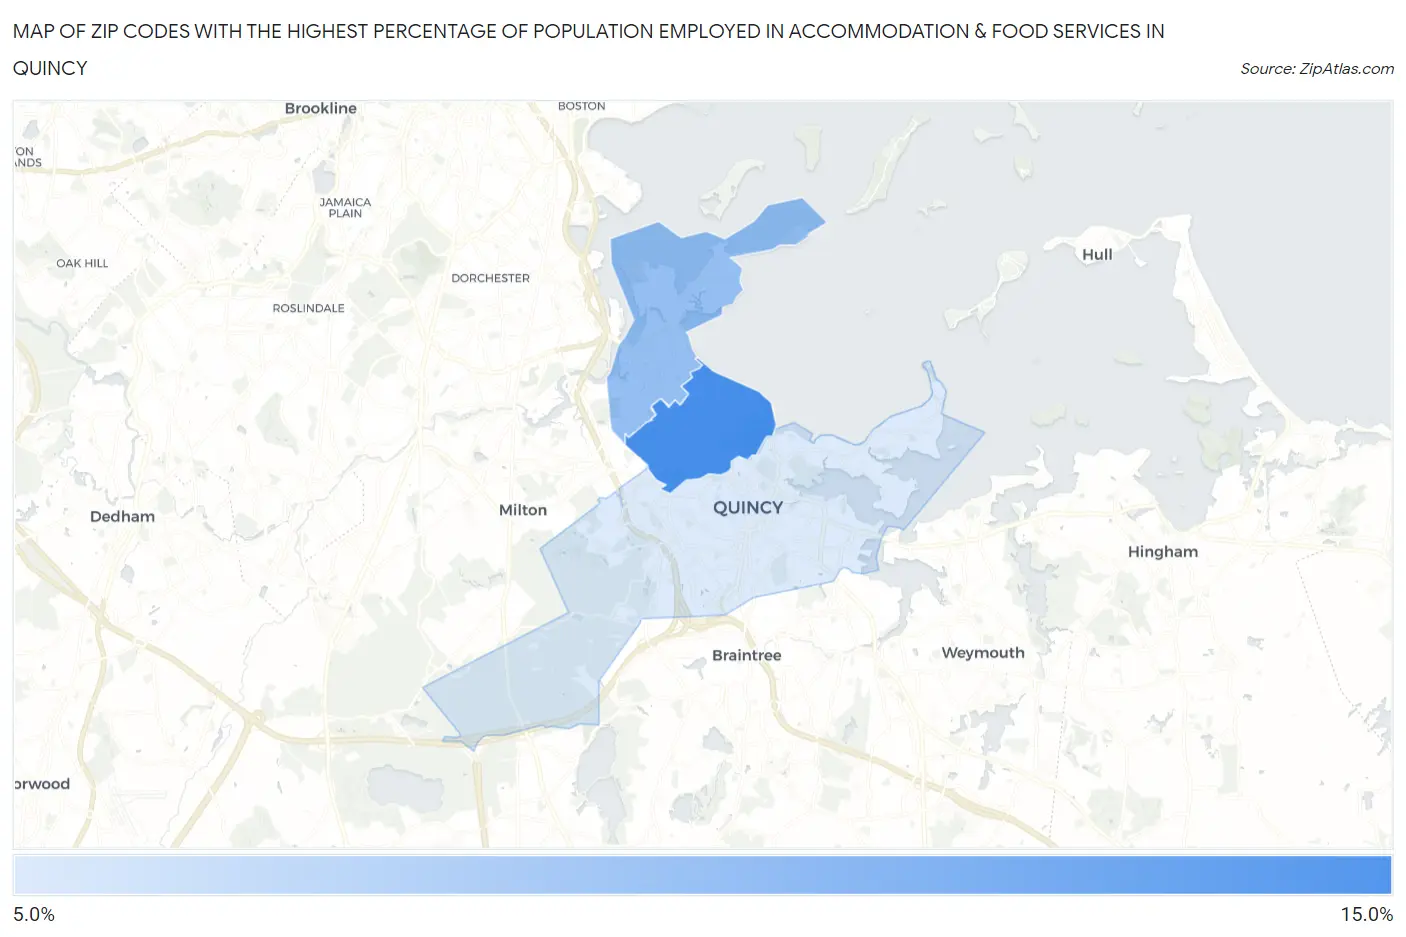
Map of Zip Codes with the Highest Percentage of Population Employed in Accommodation & Food Services in Quincy
0.0%
15.0%
Zip Codes with the Highest Percentage of Population Employed in Accommodation & Food Services in Quincy, MA
| Zip Code | % Employed | vs State | vs National | |
| 1. | 02170 | 12.8% | 5.8%(+7.07)#24 | 6.9%(+5.95)#2,418 |
| 2. | 02171 | 10.6% | 5.8%(+4.81)#39 | 6.9%(+3.69)#3,917 |
| 3. | 02169 | 8.5% | 5.8%(+2.74)#73 | 6.9%(+1.62)#6,823 |
1
Common Questions
What are the Top Zip Codes with the Highest Percentage of Population Employed in Accommodation & Food Services in Quincy, MA?
Top Zip Codes with the Highest Percentage of Population Employed in Accommodation & Food Services in Quincy, MA are:
What zip code has the Highest Percentage of Population Employed in Accommodation & Food Services in Quincy, MA?
02170 has the Highest Percentage of Population Employed in Accommodation & Food Services in Quincy, MA with 12.8%.
What is the Percentage of Population Employed in Accommodation & Food Services in Quincy, MA?
Percentage of Population Employed in Accommodation & Food Services in Quincy is 9.8%.
What is the Percentage of Population Employed in Accommodation & Food Services in Massachusetts?
Percentage of Population Employed in Accommodation & Food Services in Massachusetts is 5.8%.
What is the Percentage of Population Employed in Accommodation & Food Services in the United States?
Percentage of Population Employed in Accommodation & Food Services in the United States is 6.9%.