Immigrants from Grenada vs Immigrants from Oceania In Labor Force | Age > 16

COMPARE

Immigrants from Grenada
Race
Ancestry
AfghanAfricanAlaska NativeAlaskan AthabascanAlbanianAleutAlsatianAmericanApacheArabArapahoArgentineanArmenianAssyrian/Chaldean/SyriacAustralianAustrianBahamianBangladeshiBarbadianBasqueBelgianBelizeanBermudanBhutaneseBlackfeetBolivianBrazilianBritishBritish West IndianBulgarianBurmeseCajunCambodianCanadianCape VerdeanCarpatho RusynCelticCentral AmericanCentral American IndianCherokeeCheyenneChickasawChileanChineseChippewaChoctawColombianColvilleComancheCosta RicanCreeCreekCroatianCrowCubanCypriotCzechCzechoslovakianDanishDelawareDominicanDutchDutch West IndianEastern EuropeanEcuadorianEgyptianEnglishEstonianEthiopianEuropeanFijianFilipinoFinnishFrenchFrench American IndianFrench CanadianGermanGerman RussianGhanaianGreekGuamanian/ChamorroGuatemalanGuyaneseHaitianHmongHonduranHopiHoumaHungarianIcelanderIndian (Asian)IndonesianInupiatIranianIraqiIrishIroquoisIsraeliItalianJamaicanJapaneseJordanianKenyanKiowaKoreanLaotianLatvianLebaneseLiberianLithuanianLumbeeLuxembourgerMacedonianMalaysianMalteseMarshalleseMenomineeMexicanMexican American IndianMongolianMoroccanNative HawaiianNavajoNepaleseNew ZealanderNicaraguanNigerianNorthern EuropeanNorwegianOkinawanOsageOttawaPaiutePakistaniPalestinianPanamanianParaguayanPennsylvania GermanPeruvianPimaPolishPortuguesePotawatomiPuebloPuerto RicanPuget Sound SalishRomanianRussianSalvadoranSamoanScandinavianScotch-IrishScottishSeminoleSenegaleseSerbianShoshoneSierra LeoneanSiouxSlavicSlovakSloveneSomaliSouth AfricanSouth AmericanSouth American IndianSoviet UnionSpaniardSpanishSpanish AmericanSpanish American IndianSri LankanSubsaharan AfricanSudaneseSwedishSwissSyrianTaiwaneseThaiTlingit-HaidaTohono O'OdhamTonganTrinidadian and TobagonianTsimshianTurkishU.S. Virgin IslanderUgandanUkrainianUruguayanUteVenezuelanVietnameseWelshWest IndianYakamaYaquiYugoslavianYumanYup'ikZimbabwean
Immigration
NonimmigrantsImmigrantsAfghanistanAfricaAlbaniaArgentinaArmeniaAsiaAustraliaAustriaBahamasBangladeshBarbadosBelarusBelgiumBelizeBoliviaBosnia and HerzegovinaBrazilBulgariaBurma/MyanmarCabo VerdeCambodiaCameroonCanadaCaribbeanCentral AmericaChileChinaColombiaCongoCosta RicaCroatiaCubaCzechoslovakiaDenmarkDominicaDominican RepublicEastern AfricaEastern AsiaEastern EuropeEcuadorEgyptEl SalvadorEnglandEritreaEthiopiaEuropeFijiFranceGermanyGhanaGreeceGrenadaGuatemalaGuyanaHaitiHondurasHong KongHungaryIndiaIndonesiaIranIraqIrelandIsraelItalyJamaicaJapanJordanKazakhstanKenyaKoreaKuwaitLaosLatin AmericaLatviaLebanonLiberiaLithuaniaMalaysiaMexicoMicronesiaMiddle AfricaMoldovaMoroccoNepalNetherlandsNicaraguaNigeriaNorth AmericaNorth MacedoniaNorthern AfricaNorthern EuropeNorwayPakistanPanamaPeruPhilippinesPolandPortugalRomaniaRussiaSaudi ArabiaScotlandSenegalSerbiaSierra LeoneSingaporeSomaliaSouth AfricaSouth AmericaSouth Central AsiaSouth Eastern AsiaSouthern EuropeSpainSri LankaSt. Vincent and the GrenadinesSudanSwedenSwitzerlandSyriaTaiwanThailandTrinidad and TobagoTurkeyUgandaUkraineUruguayUzbekistanVenezuelaVietnamWest IndiesWestern AfricaWestern AsiaWestern EuropeYemenZaireZimbabweAzores
Immigrants from Oceania
Race
Ancestry
AfghanAfricanAlaska NativeAlaskan AthabascanAlbanianAleutAlsatianAmericanApacheArabArapahoArgentineanArmenianAssyrian/Chaldean/SyriacAustralianAustrianBahamianBangladeshiBarbadianBasqueBelgianBelizeanBermudanBhutaneseBlackfeetBolivianBrazilianBritishBritish West IndianBulgarianBurmeseCajunCambodianCanadianCape VerdeanCarpatho RusynCelticCentral AmericanCentral American IndianCherokeeCheyenneChickasawChileanChineseChippewaChoctawColombianColvilleComancheCosta RicanCreeCreekCroatianCrowCubanCypriotCzechCzechoslovakianDanishDelawareDominicanDutchDutch West IndianEastern EuropeanEcuadorianEgyptianEnglishEstonianEthiopianEuropeanFijianFilipinoFinnishFrenchFrench American IndianFrench CanadianGermanGerman RussianGhanaianGreekGuamanian/ChamorroGuatemalanGuyaneseHaitianHmongHonduranHopiHoumaHungarianIcelanderIndian (Asian)IndonesianInupiatIranianIraqiIrishIroquoisIsraeliItalianJamaicanJapaneseJordanianKenyanKiowaKoreanLaotianLatvianLebaneseLiberianLithuanianLumbeeLuxembourgerMacedonianMalaysianMalteseMarshalleseMenomineeMexicanMexican American IndianMongolianMoroccanNative HawaiianNavajoNepaleseNew ZealanderNicaraguanNigerianNorthern EuropeanNorwegianOkinawanOsageOttawaPaiutePakistaniPalestinianPanamanianParaguayanPennsylvania GermanPeruvianPimaPolishPortuguesePotawatomiPuebloPuerto RicanPuget Sound SalishRomanianRussianSalvadoranSamoanScandinavianScotch-IrishScottishSeminoleSenegaleseSerbianShoshoneSierra LeoneanSiouxSlavicSlovakSloveneSomaliSouth AfricanSouth AmericanSouth American IndianSoviet UnionSpaniardSpanishSpanish AmericanSpanish American IndianSri LankanSubsaharan AfricanSudaneseSwedishSwissSyrianTaiwaneseThaiTlingit-HaidaTohono O'OdhamTonganTrinidadian and TobagonianTsimshianTurkishU.S. Virgin IslanderUgandanUkrainianUruguayanUteVenezuelanVietnameseWelshWest IndianYakamaYaquiYugoslavianYumanYup'ikZimbabwean
Immigration
NonimmigrantsImmigrantsAfghanistanAfricaAlbaniaArgentinaArmeniaAsiaAustraliaAustriaBahamasBangladeshBarbadosBelarusBelgiumBelizeBoliviaBosnia and HerzegovinaBrazilBulgariaBurma/MyanmarCabo VerdeCambodiaCameroonCanadaCaribbeanCentral AmericaChileChinaColombiaCongoCosta RicaCroatiaCubaCzechoslovakiaDenmarkDominicaDominican RepublicEastern AfricaEastern AsiaEastern EuropeEcuadorEgyptEl SalvadorEnglandEritreaEthiopiaEuropeFijiFranceGermanyGhanaGreeceGuatemalaGuyanaHaitiHondurasHong KongHungaryIndiaIndonesiaIranIraqIrelandIsraelItalyJamaicaJapanJordanKazakhstanKenyaKoreaKuwaitLaosLatin AmericaLatviaLebanonLiberiaLithuaniaMalaysiaMexicoMicronesiaMiddle AfricaMoldovaMoroccoNepalNetherlandsNicaraguaNigeriaNorth AmericaNorth MacedoniaNorthern AfricaNorthern EuropeNorwayOceaniaPakistanPanamaPeruPhilippinesPolandPortugalRomaniaRussiaSaudi ArabiaScotlandSenegalSerbiaSierra LeoneSingaporeSomaliaSouth AfricaSouth AmericaSouth Central AsiaSouth Eastern AsiaSouthern EuropeSpainSri LankaSt. Vincent and the GrenadinesSudanSwedenSwitzerlandSyriaTaiwanThailandTrinidad and TobagoTurkeyUgandaUkraineUruguayUzbekistanVenezuelaVietnamWest IndiesWestern AfricaWestern AsiaWestern EuropeYemenZaireZimbabweAzores
In Labor Force | Age > 16
Income
Poverty
Unemployment
Labor Participation
Family Structure
Vehicle Availability
Education Level
Disability

In Labor Force | Age > 16 Comparison

Immigrants from Grenada

Immigrants from Oceania

Tragic
Excellent
63.6%
IN LABOR FORCE | AGE > 16
0.0/ 100
METRIC RATING
297th/ 347
METRIC RANK
65.5%
IN LABOR FORCE | AGE > 16
87.5/ 100
METRIC RATING
147th/ 347
METRIC RANK

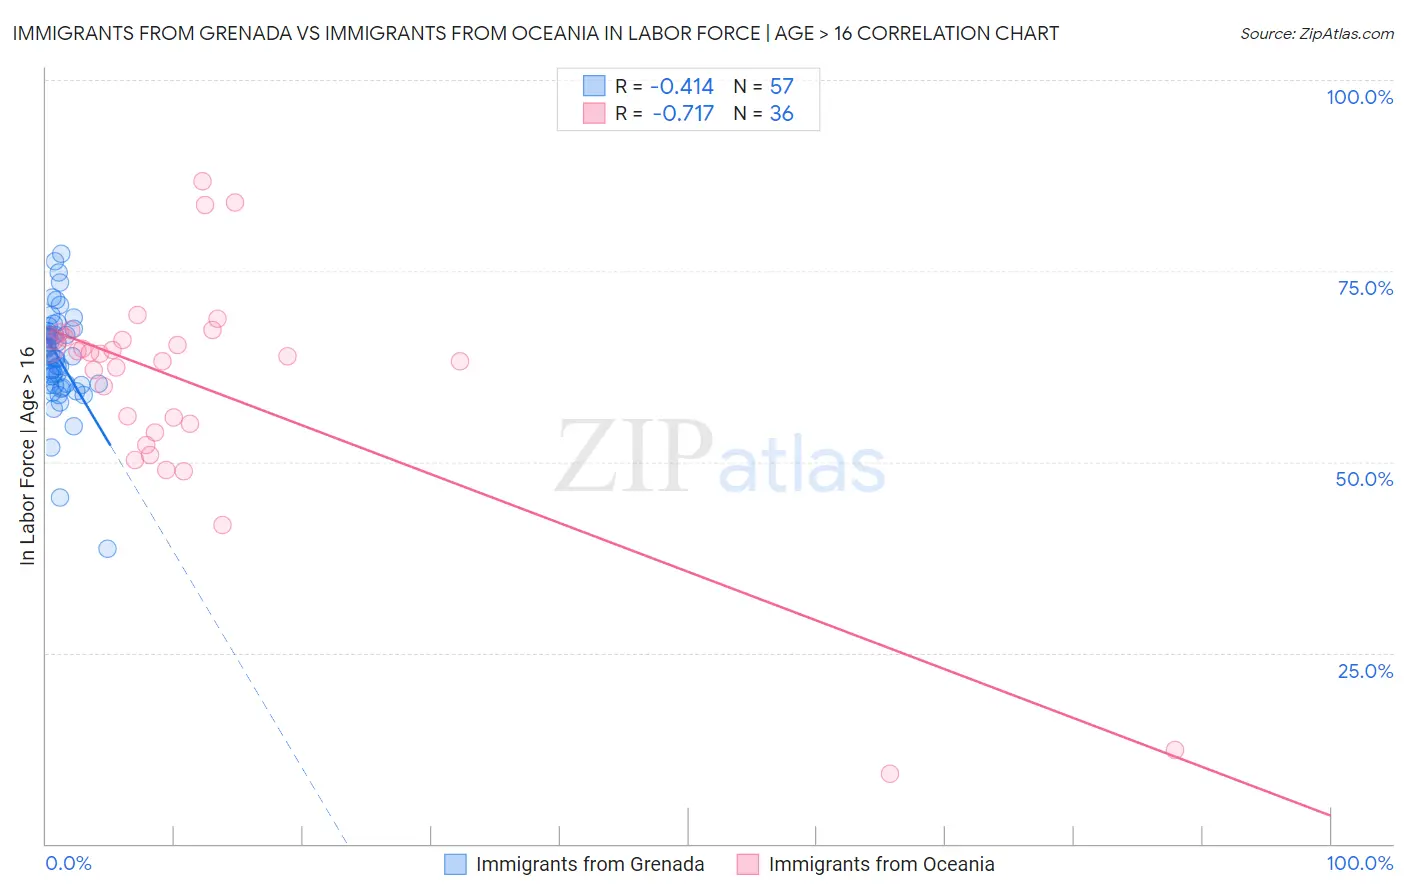
Immigrants from Grenada vs Immigrants from Oceania In Labor Force | Age > 16 Correlation Chart

The statistical analysis conducted on geographies consisting of 67,200,559 people shows a moderate negative correlation between the proportion of Immigrants from Grenada and labor force participation rate among population ages 16 and over in the United States with a correlation coefficient (R) of -0.414 and weighted average of 63.6%. Similarly, the statistical analysis conducted on geographies consisting of 305,520,725 people shows a strong negative correlation between the proportion of Immigrants from Oceania and labor force participation rate among population ages 16 and over in the United States with a correlation coefficient (R) of -0.717 and weighted average of 65.5%, a difference of 2.9%.
Immigrants from Grenada vs Immigrants from Oceania In Labor Force | Age > 16

In Labor Force | Age > 16 Correlation Summary

MeasurementImmigrants from GrenadaImmigrants from Oceania
Minimum38.7%9.1%
Maximum77.2%86.8%
Range38.5%77.7%
Mean63.6%59.8%
Median63.8%63.9%
Interquartile 25% (IQ1)60.1%54.4%
Interquartile 75% (IQ3)66.9%66.1%
Interquartile Range (IQR)6.9%11.7%
Standard Deviation (Sample)6.6%15.4%
Standard Deviation (Population)6.5%15.2%

Similar Demographics by In Labor Force | Age > 16

Demographics Similar to Immigrants from Grenada by In Labor Force | Age > 16

In terms of in labor force | age > 16, the demographic groups most similar to Immigrants from Grenada are Comanche (63.6%, a difference of 0.010%), White/Caucasian (63.6%, a difference of 0.060%), Immigrants from the Azores (63.6%, a difference of 0.070%), Immigrants from North America (63.7%, a difference of 0.080%), and Immigrants from Canada (63.7%, a difference of 0.10%).
DemographicsRating | RankIn Labor Force | Age > 16
Hungarians
0.1
/100
|
#290
Tragic
63.8%
Nepalese
0.1
/100
|
#291
Tragic
63.8%
Spanish American Indians
0.1
/100
|
#292
Tragic
63.8%
English
0.1
/100
|
#293
Tragic
63.7%
Puget Sound Salish
0.0
/100
|
#294
Tragic
63.7%
Immigrants | Canada
0.0
/100
|
#295
Tragic
63.7%
Immigrants | North America
0.0
/100
|
#296
Tragic
63.7%
Immigrants | Grenada
0.0
/100
|
#297
Tragic
63.6%
Comanche
0.0
/100
|
#298
Tragic
63.6%
Whites/Caucasians
0.0
/100
|
#299
Tragic
63.6%
Immigrants | Azores
0.0
/100
|
#300
Tragic
63.6%
Spanish Americans
0.0
/100
|
#301
Tragic
63.6%
Delaware
0.0
/100
|
#302
Tragic
63.6%
Cree
0.0
/100
|
#303
Tragic
63.5%
Immigrants | Nonimmigrants
0.0
/100
|
#304
Tragic
63.5%

Demographics Similar to Immigrants from Oceania by In Labor Force | Age > 16

In terms of in labor force | age > 16, the demographic groups most similar to Immigrants from Oceania are Tlingit-Haida (65.5%, a difference of 0.020%), Cypriot (65.5%, a difference of 0.020%), Immigrants from Romania (65.5%, a difference of 0.030%), Bhutanese (65.5%, a difference of 0.030%), and Immigrants from Albania (65.4%, a difference of 0.040%).
DemographicsRating | RankIn Labor Force | Age > 16
Immigrants | Costa Rica
90.8
/100
|
#140
Exceptional
65.5%
Samoans
90.5
/100
|
#141
Exceptional
65.5%
Indians (Asian)
89.5
/100
|
#142
Excellent
65.5%
Latvians
89.4
/100
|
#143
Excellent
65.5%
Immigrants | Romania
88.6
/100
|
#144
Excellent
65.5%
Tlingit-Haida
88.3
/100
|
#145
Excellent
65.5%
Cypriots
88.2
/100
|
#146
Excellent
65.5%
Immigrants | Oceania
87.5
/100
|
#147
Excellent
65.5%
Bhutanese
86.3
/100
|
#148
Excellent
65.5%
Immigrants | Albania
85.7
/100
|
#149
Excellent
65.4%
Immigrants | Immigrants
81.9
/100
|
#150
Excellent
65.4%
Czechs
81.5
/100
|
#151
Excellent
65.4%
Yugoslavians
81.3
/100
|
#152
Excellent
65.4%
Immigrants | China
80.5
/100
|
#153
Excellent
65.4%
Immigrants | Eastern Europe
78.3
/100
|
#154
Good
65.4%