Immigrants from Grenada vs Colombian In Labor Force | Age > 16

COMPARE

Immigrants from Grenada
Race
Ancestry
AfghanAfricanAlaska NativeAlaskan AthabascanAlbanianAleutAlsatianAmericanApacheArabArapahoArgentineanArmenianAssyrian/Chaldean/SyriacAustralianAustrianBahamianBangladeshiBarbadianBasqueBelgianBelizeanBermudanBhutaneseBlackfeetBolivianBrazilianBritishBritish West IndianBulgarianBurmeseCajunCambodianCanadianCape VerdeanCarpatho RusynCelticCentral AmericanCentral American IndianCherokeeCheyenneChickasawChileanChineseChippewaChoctawColvilleComancheCosta RicanCreeCreekCroatianCrowCubanCypriotCzechCzechoslovakianDanishDelawareDominicanDutchDutch West IndianEastern EuropeanEcuadorianEgyptianEnglishEstonianEthiopianEuropeanFijianFilipinoFinnishFrenchFrench American IndianFrench CanadianGermanGerman RussianGhanaianGreekGuamanian/ChamorroGuatemalanGuyaneseHaitianHmongHonduranHopiHoumaHungarianIcelanderIndian (Asian)IndonesianInupiatIranianIraqiIrishIroquoisIsraeliItalianJamaicanJapaneseJordanianKenyanKiowaKoreanLaotianLatvianLebaneseLiberianLithuanianLumbeeLuxembourgerMacedonianMalaysianMalteseMarshalleseMenomineeMexicanMexican American IndianMongolianMoroccanNative HawaiianNavajoNepaleseNew ZealanderNicaraguanNigerianNorthern EuropeanNorwegianOkinawanOsageOttawaPaiutePakistaniPalestinianPanamanianParaguayanPennsylvania GermanPeruvianPimaPolishPortuguesePotawatomiPuebloPuerto RicanPuget Sound SalishRomanianRussianSalvadoranSamoanScandinavianScotch-IrishScottishSeminoleSenegaleseSerbianShoshoneSierra LeoneanSiouxSlavicSlovakSloveneSomaliSouth AfricanSouth AmericanSouth American IndianSoviet UnionSpaniardSpanishSpanish AmericanSpanish American IndianSri LankanSubsaharan AfricanSudaneseSwedishSwissSyrianTaiwaneseThaiTlingit-HaidaTohono O'OdhamTonganTrinidadian and TobagonianTsimshianTurkishU.S. Virgin IslanderUgandanUkrainianUruguayanUteVenezuelanVietnameseWelshWest IndianYakamaYaquiYugoslavianYumanYup'ikZimbabwean
Immigration
NonimmigrantsImmigrantsAfghanistanAfricaAlbaniaArgentinaArmeniaAsiaAustraliaAustriaBahamasBangladeshBarbadosBelarusBelgiumBelizeBoliviaBosnia and HerzegovinaBrazilBulgariaBurma/MyanmarCabo VerdeCambodiaCameroonCanadaCaribbeanCentral AmericaChileChinaColombiaCongoCosta RicaCroatiaCubaCzechoslovakiaDenmarkDominicaDominican RepublicEastern AfricaEastern AsiaEastern EuropeEcuadorEgyptEl SalvadorEnglandEritreaEthiopiaEuropeFijiFranceGermanyGhanaGreeceGrenadaGuatemalaGuyanaHaitiHondurasHong KongHungaryIndiaIndonesiaIranIraqIrelandIsraelItalyJamaicaJapanJordanKazakhstanKenyaKoreaKuwaitLaosLatin AmericaLatviaLebanonLiberiaLithuaniaMalaysiaMexicoMicronesiaMiddle AfricaMoldovaMoroccoNepalNetherlandsNicaraguaNigeriaNorth AmericaNorth MacedoniaNorthern AfricaNorthern EuropeNorwayOceaniaPakistanPanamaPeruPhilippinesPolandPortugalRomaniaRussiaSaudi ArabiaScotlandSenegalSerbiaSierra LeoneSingaporeSomaliaSouth AfricaSouth AmericaSouth Central AsiaSouth Eastern AsiaSouthern EuropeSpainSri LankaSt. Vincent and the GrenadinesSudanSwedenSwitzerlandSyriaTaiwanThailandTrinidad and TobagoTurkeyUgandaUkraineUruguayUzbekistanVenezuelaVietnamWest IndiesWestern AfricaWestern AsiaWestern EuropeYemenZaireZimbabweAzores
Colombian
Race
Ancestry
AfghanAfricanAlaska NativeAlaskan AthabascanAlbanianAleutAlsatianAmericanApacheArabArapahoArgentineanArmenianAssyrian/Chaldean/SyriacAustralianAustrianBahamianBangladeshiBarbadianBasqueBelgianBelizeanBermudanBhutaneseBlackfeetBolivianBrazilianBritishBritish West IndianBulgarianBurmeseCajunCambodianCanadianCape VerdeanCarpatho RusynCelticCentral AmericanCentral American IndianCherokeeCheyenneChickasawChileanChineseChippewaChoctawColombianColvilleComancheCosta RicanCreeCreekCroatianCrowCubanCypriotCzechCzechoslovakianDanishDelawareDominicanDutchDutch West IndianEastern EuropeanEcuadorianEgyptianEnglishEstonianEthiopianEuropeanFijianFilipinoFinnishFrenchFrench American IndianFrench CanadianGermanGerman RussianGhanaianGreekGuamanian/ChamorroGuatemalanGuyaneseHaitianHmongHonduranHopiHoumaHungarianIcelanderIndian (Asian)IndonesianInupiatIranianIraqiIrishIroquoisIsraeliItalianJamaicanJapaneseJordanianKenyanKiowaKoreanLaotianLatvianLebaneseLiberianLithuanianLumbeeLuxembourgerMacedonianMalaysianMalteseMarshalleseMenomineeMexicanMexican American IndianMongolianMoroccanNative HawaiianNavajoNepaleseNew ZealanderNicaraguanNigerianNorthern EuropeanNorwegianOkinawanOsageOttawaPaiutePakistaniPalestinianPanamanianParaguayanPennsylvania GermanPeruvianPimaPolishPortuguesePotawatomiPuebloPuerto RicanPuget Sound SalishRomanianRussianSalvadoranSamoanScandinavianScotch-IrishScottishSeminoleSenegaleseSerbianShoshoneSierra LeoneanSiouxSlavicSlovakSloveneSomaliSouth AfricanSouth AmericanSouth American IndianSoviet UnionSpaniardSpanishSpanish AmericanSpanish American IndianSri LankanSubsaharan AfricanSudaneseSwedishSwissSyrianTaiwaneseThaiTlingit-HaidaTohono O'OdhamTonganTrinidadian and TobagonianTsimshianTurkishU.S. Virgin IslanderUgandanUkrainianUruguayanUteVenezuelanVietnameseWelshWest IndianYakamaYaquiYugoslavianYumanYup'ikZimbabwean
Immigration
NonimmigrantsImmigrantsAfghanistanAfricaAlbaniaArgentinaArmeniaAsiaAustraliaAustriaBahamasBangladeshBarbadosBelarusBelgiumBelizeBoliviaBosnia and HerzegovinaBrazilBulgariaBurma/MyanmarCabo VerdeCambodiaCameroonCanadaCaribbeanCentral AmericaChileChinaColombiaCongoCosta RicaCroatiaCubaCzechoslovakiaDenmarkDominicaDominican RepublicEastern AfricaEastern AsiaEastern EuropeEcuadorEgyptEl SalvadorEnglandEritreaEthiopiaEuropeFijiFranceGermanyGhanaGreeceGuatemalaGuyanaHaitiHondurasHong KongHungaryIndiaIndonesiaIranIraqIrelandIsraelItalyJamaicaJapanJordanKazakhstanKenyaKoreaKuwaitLaosLatin AmericaLatviaLebanonLiberiaLithuaniaMalaysiaMexicoMicronesiaMiddle AfricaMoldovaMoroccoNepalNetherlandsNicaraguaNigeriaNorth AmericaNorth MacedoniaNorthern AfricaNorthern EuropeNorwayOceaniaPakistanPanamaPeruPhilippinesPolandPortugalRomaniaRussiaSaudi ArabiaScotlandSenegalSerbiaSierra LeoneSingaporeSomaliaSouth AfricaSouth AmericaSouth Central AsiaSouth Eastern AsiaSouthern EuropeSpainSri LankaSt. Vincent and the GrenadinesSudanSwedenSwitzerlandSyriaTaiwanThailandTrinidad and TobagoTurkeyUgandaUkraineUruguayUzbekistanVenezuelaVietnamWest IndiesWestern AfricaWestern AsiaWestern EuropeYemenZaireZimbabweAzores
In Labor Force | Age > 16
Income
Poverty
Unemployment
Labor Participation
Family Structure
Vehicle Availability
Education Level
Disability

In Labor Force | Age > 16 Comparison

Immigrants from Grenada

Colombians

Tragic
Exceptional
63.6%
IN LABOR FORCE | AGE > 16
0.0/ 100
METRIC RATING
297th/ 347
METRIC RANK
65.9%
IN LABOR FORCE | AGE > 16
98.4/ 100
METRIC RATING
105th/ 347
METRIC RANK

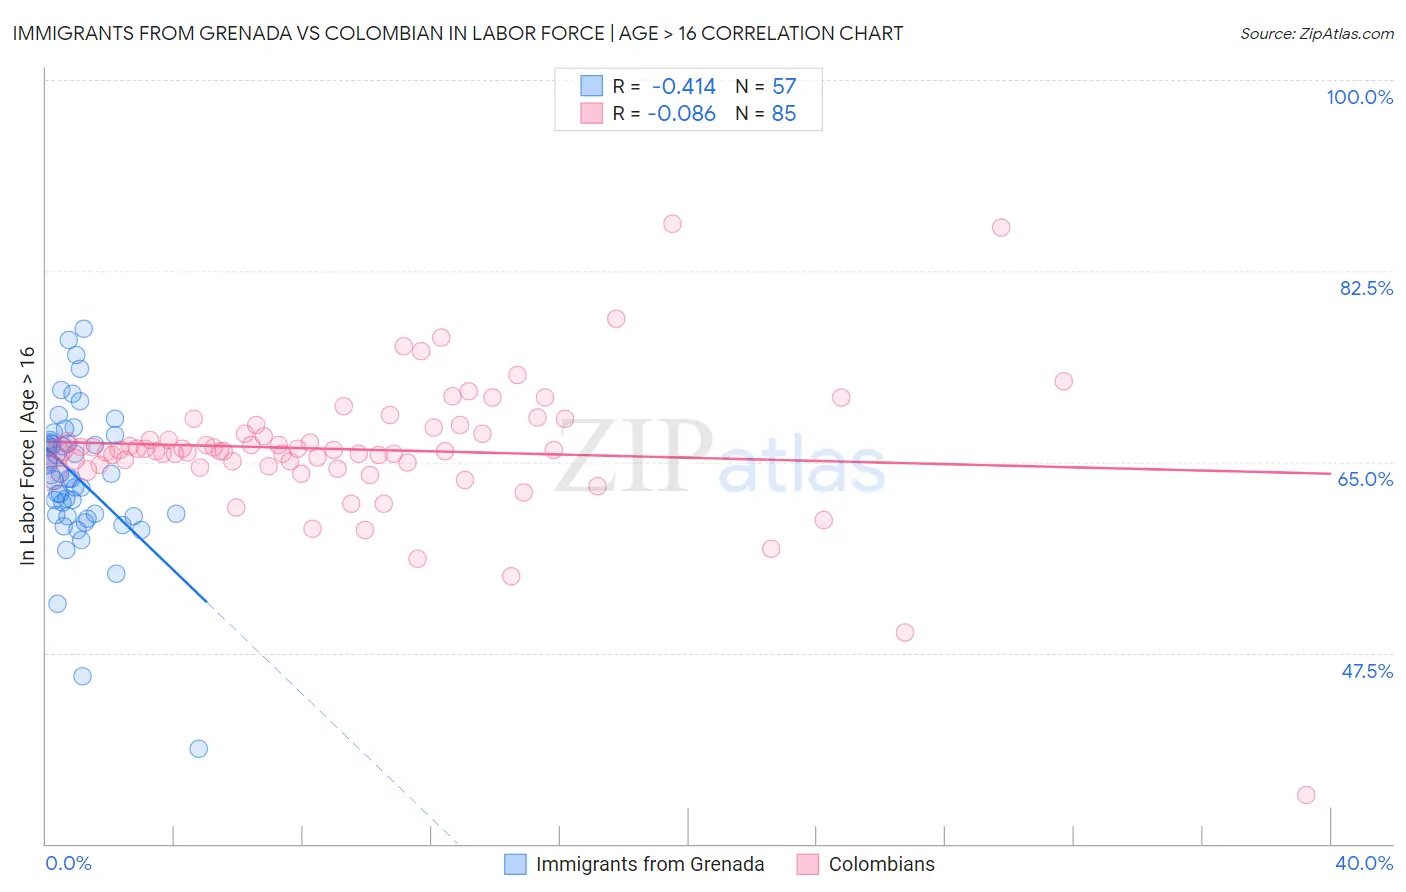
Immigrants from Grenada vs Colombian In Labor Force | Age > 16 Correlation Chart

The statistical analysis conducted on geographies consisting of 67,200,559 people shows a moderate negative correlation between the proportion of Immigrants from Grenada and labor force participation rate among population ages 16 and over in the United States with a correlation coefficient (R) of -0.414 and weighted average of 63.6%. Similarly, the statistical analysis conducted on geographies consisting of 419,691,695 people shows a slight negative correlation between the proportion of Colombians and labor force participation rate among population ages 16 and over in the United States with a correlation coefficient (R) of -0.086 and weighted average of 65.9%, a difference of 3.5%.
Immigrants from Grenada vs Colombian In Labor Force | Age > 16

In Labor Force | Age > 16 Correlation Summary

MeasurementImmigrants from GrenadaColombian
Minimum38.7%34.5%
Maximum77.2%86.8%
Range38.5%52.3%
Mean63.6%66.1%
Median63.8%66.0%
Interquartile 25% (IQ1)60.1%64.6%
Interquartile 75% (IQ3)66.9%67.9%
Interquartile Range (IQR)6.9%3.2%
Standard Deviation (Sample)6.6%6.4%
Standard Deviation (Population)6.5%6.4%

Similar Demographics by In Labor Force | Age > 16

Demographics Similar to Immigrants from Grenada by In Labor Force | Age > 16

In terms of in labor force | age > 16, the demographic groups most similar to Immigrants from Grenada are Comanche (63.6%, a difference of 0.010%), White/Caucasian (63.6%, a difference of 0.060%), Immigrants from the Azores (63.6%, a difference of 0.070%), Immigrants from North America (63.7%, a difference of 0.080%), and Immigrants from Canada (63.7%, a difference of 0.10%).
DemographicsRating | RankIn Labor Force | Age > 16
Hungarians
0.1
/100
|
#290
Tragic
63.8%
Nepalese
0.1
/100
|
#291
Tragic
63.8%
Spanish American Indians
0.1
/100
|
#292
Tragic
63.8%
English
0.1
/100
|
#293
Tragic
63.7%
Puget Sound Salish
0.0
/100
|
#294
Tragic
63.7%
Immigrants | Canada
0.0
/100
|
#295
Tragic
63.7%
Immigrants | North America
0.0
/100
|
#296
Tragic
63.7%
Immigrants | Grenada
0.0
/100
|
#297
Tragic
63.6%
Comanche
0.0
/100
|
#298
Tragic
63.6%
Whites/Caucasians
0.0
/100
|
#299
Tragic
63.6%
Immigrants | Azores
0.0
/100
|
#300
Tragic
63.6%
Spanish Americans
0.0
/100
|
#301
Tragic
63.6%
Delaware
0.0
/100
|
#302
Tragic
63.6%
Cree
0.0
/100
|
#303
Tragic
63.5%
Immigrants | Nonimmigrants
0.0
/100
|
#304
Tragic
63.5%

Demographics Similar to Colombians by In Labor Force | Age > 16

In terms of in labor force | age > 16, the demographic groups most similar to Colombians are Palestinian (65.9%, a difference of 0.010%), Immigrants from South Eastern Asia (65.9%, a difference of 0.020%), Immigrants from Colombia (65.9%, a difference of 0.040%), Uruguayan (65.9%, a difference of 0.040%), and Immigrants from Serbia (65.8%, a difference of 0.040%).
DemographicsRating | RankIn Labor Force | Age > 16
Immigrants | Chile
98.7
/100
|
#98
Exceptional
65.9%
Immigrants | Australia
98.7
/100
|
#99
Exceptional
65.9%
Okinawans
98.7
/100
|
#100
Exceptional
65.9%
Immigrants | Colombia
98.6
/100
|
#101
Exceptional
65.9%
Uruguayans
98.6
/100
|
#102
Exceptional
65.9%
Immigrants | South Eastern Asia
98.5
/100
|
#103
Exceptional
65.9%
Palestinians
98.5
/100
|
#104
Exceptional
65.9%
Colombians
98.4
/100
|
#105
Exceptional
65.9%
Immigrants | Serbia
98.1
/100
|
#106
Exceptional
65.8%
Immigrants | Poland
98.1
/100
|
#107
Exceptional
65.8%
Immigrants | Spain
98.0
/100
|
#108
Exceptional
65.8%
Immigrants | Japan
98.0
/100
|
#109
Exceptional
65.8%
Japanese
97.7
/100
|
#110
Exceptional
65.8%
Immigrants | Honduras
97.5
/100
|
#111
Exceptional
65.8%
Laotians
97.4
/100
|
#112
Exceptional
65.8%