Zip Codes with the Highest Poverty Level Among Children Under the Age of 5 in Wichita, KS

RELATED REPORTS & OPTIONS

Highest Poverty | Child 0-5
Population
Families and Households
Female Fertility
Female Fertility (Unmarried)
Race (Community Size)
Race (Percentage)
Ancestry (Community Size)
AfricanAlaska NativeAmericanApacheArabArapahoArgentineanArmenianAustralianAustrianBangladeshiBarbadianBelgianBhutaneseBlackfeetBolivianBrazilianBritishBulgarianBurmeseCajunCanadianCelticCentral AmericanCentral American IndianCherokeeCheyenneChickasawChileanChippewaChoctawColombianComancheCosta RicanCreekCroatianCubanCzechCzechoslovakianDanishDelawareDominicanDutchDutch West IndianEastern EuropeanEcuadorianEgyptianEnglishEthiopianEuropeanFilipinoFinnishFrenchFrench American IndianFrench CanadianGermanGerman RussianGhanaianGreekGuamanian / ChamorroGuatemalanHaitianHonduranHungarianIcelanderIndian (Asian)IndonesianInupiatIranianIrishIroquoisItalianJamaicanJapaneseJordanianKenyanKiowaKoreanLaotianLebaneseLithuanianLuxembourgerMalaysianMexicanMexican American IndianMongolianMoroccanNative HawaiianNavajoNicaraguanNigerianNorthern EuropeanNorwegianOsageOttawaPakistaniPalestinianPanamanianParaguayanPennsylvania GermanPeruvianPimaPolishPortuguesePotawatomiPuebloPuerto RicanRomanianRussianSalvadoranSamoanScandinavianScotch-IrishScottishSeminoleSiouxSlavicSlovakSloveneSouth AfricanSouth AmericanSpaniardSpanishSpanish AmericanSpanish American IndianSri LankanSubsaharan AfricanSwedishSwissSyrianThaiTrinidadian and TobagonianTurkishUgandanUkrainianVenezuelanWelshWest IndianYugoslavian
Ancestry (Percentage)
AfricanAlaska NativeAmericanApacheArabArapahoArgentineanArmenianAustralianAustrianBangladeshiBarbadianBelgianBhutaneseBlackfeetBolivianBrazilianBritishBulgarianBurmeseCajunCanadianCelticCentral AmericanCentral American IndianCherokeeCheyenneChickasawChileanChippewaChoctawColombianComancheCosta RicanCreekCroatianCubanCzechCzechoslovakianDanishDelawareDominicanDutchDutch West IndianEastern EuropeanEcuadorianEgyptianEnglishEthiopianEuropeanFilipinoFinnishFrenchFrench American IndianFrench CanadianGermanGerman RussianGhanaianGreekGuamanian / ChamorroGuatemalanHaitianHonduranHungarianIcelanderIndian (Asian)IndonesianInupiatIranianIrishIroquoisItalianJamaicanJapaneseJordanianKenyanKiowaKoreanLaotianLebaneseLithuanianLuxembourgerMalaysianMexicanMexican American IndianMongolianMoroccanNative HawaiianNavajoNicaraguanNigerianNorthern EuropeanNorwegianOsageOttawaPakistaniPalestinianPanamanianParaguayanPennsylvania GermanPeruvianPimaPolishPortuguesePotawatomiPuebloPuerto RicanRomanianRussianSalvadoranSamoanScandinavianScotch-IrishScottishSeminoleSiouxSlavicSlovakSloveneSouth AfricanSouth AmericanSpaniardSpanishSpanish AmericanSpanish American IndianSri LankanSubsaharan AfricanSwedishSwissSyrianThaiTrinidadian and TobagonianTurkishUgandanUkrainianVenezuelanWelshWest IndianYugoslavian
Immigrant Origin (Total)
Immigrant Origin (Percentage)
Income
Income (Families)
Income (Households)
Poverty
Poverty (Families)
Unemployment
Employment Occupations
Employment Industries
Employer Class
Commute Time
Commute Means
School Enrollment
Education by Degree Field
Occupancy
Finances
Physical Characteristics
Wichita
Compare Zip Codes
Comparison Subject

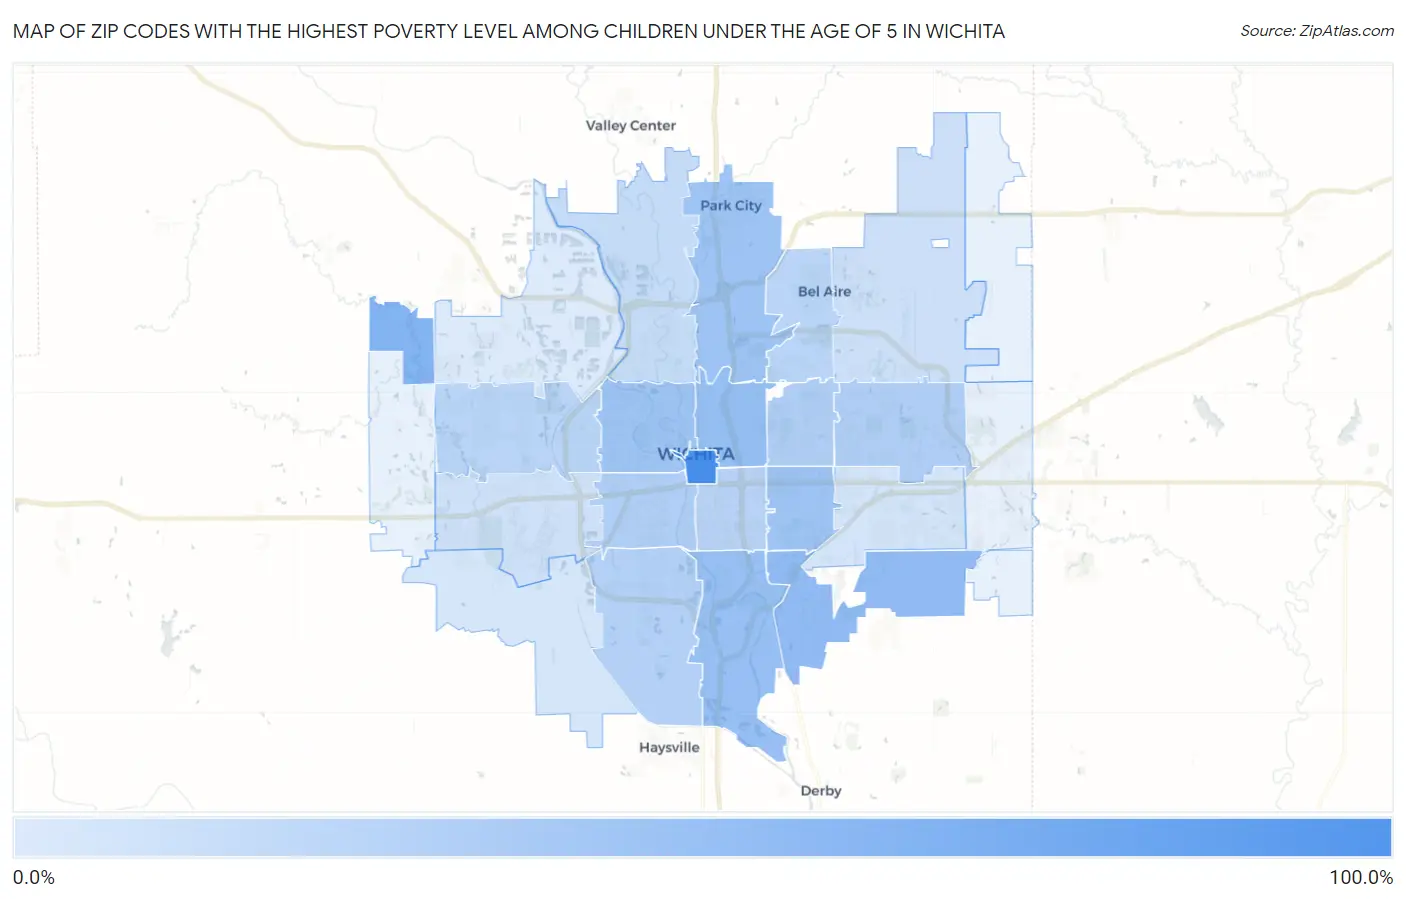
Map of Zip Codes with the Highest Poverty Level Among Children Under the Age of 5 in Wichita

0.0%
100.0%
Zip Codes with the Highest Poverty Level Among Children Under the Age of 5 in Wichita Map

Zip Codes with the Highest Poverty Level Among Children Under the Age of 5 in Wichita, KS

Zip Code Child Poverty vs State vs National
1.67202100.0%16.0%(+84.0)#118.1%(+81.9)#27
2.6722354.2%16.0%(+38.2)#4418.1%(+36.2)#2,124
3.6721045.1%16.0%(+29.1)#6118.1%(+27.0)#3,174
4.6721441.9%16.0%(+25.9)#7018.1%(+23.8)#3,679
5.6721640.6%16.0%(+24.6)#7218.1%(+22.5)#3,921
6.6721936.6%16.0%(+20.6)#8718.1%(+18.5)#4,679
7.6721836.3%16.0%(+20.3)#9318.1%(+18.2)#4,755
8.6720335.4%16.0%(+19.4)#9618.1%(+17.3)#4,987
9.6720826.9%16.0%(+10.9)#12918.1%(+8.85)#7,333
10.6720626.9%16.0%(+10.9)#13018.1%(+8.80)#7,350
11.6721325.1%16.0%(+9.15)#13818.1%(+7.07)#7,941
12.6721724.1%16.0%(+8.09)#14318.1%(+6.01)#8,323
13.6721121.7%16.0%(+5.73)#16318.1%(+3.65)#9,308
14.6721220.6%16.0%(+4.64)#17418.1%(+2.56)#9,752
15.6722020.5%16.0%(+4.50)#17618.1%(+2.42)#9,811
16.6720414.0%16.0%(-1.97)#23318.1%(-4.05)#13,028
17.6722611.0%16.0%(-5.00)#27218.1%(-7.08)#14,840
18.672099.9%16.0%(-6.12)#28618.1%(-8.20)#15,501
19.672077.2%16.0%(-8.81)#32118.1%(-10.9)#17,267
20.672156.6%16.0%(-9.38)#33218.1%(-11.5)#17,668
21.672053.3%16.0%(-12.7)#37418.1%(-14.7)#19,961

Common Questions

What are the Top 10 Zip Codes with the Highest Poverty Level Among Children Under the Age of 5 in Wichita, KS?
Top 10 Zip Codes with the Highest Poverty Level Among Children Under the Age of 5 in Wichita, KS are:
#1
100.0%
#2
54.2%
#3
45.1%
#4
41.9%
#5
40.6%
#6
36.6%
#7
36.3%
#8
35.4%
#9
26.9%
#10
26.9%
What zip code has the Highest Poverty Level Among Children Under the Age of 5 in Wichita, KS?
67202 has the Highest Poverty Level Among Children Under the Age of 5 in Wichita, KS with 100.0%.
What is the Poverty Level Among Children Under the Age of 5 in Wichita, KS?
Poverty Level Among Children Under the Age of 5 in Wichita is 22.5%.
What is the Poverty Level Among Children Under the Age of 5 in Kansas?
Poverty Level Among Children Under the Age of 5 in Kansas is 16.0%.
What is the Poverty Level Among Children Under the Age of 5 in the United States?
Poverty Level Among Children Under the Age of 5 in the United States is 18.1%.