Zip Codes with the Highest Percentage of Families with Income Above $200,000 in Wichita, KS
RELATED REPORTS & OPTIONS
Family Income | $200k+
Wichita
Compare Zip Codes
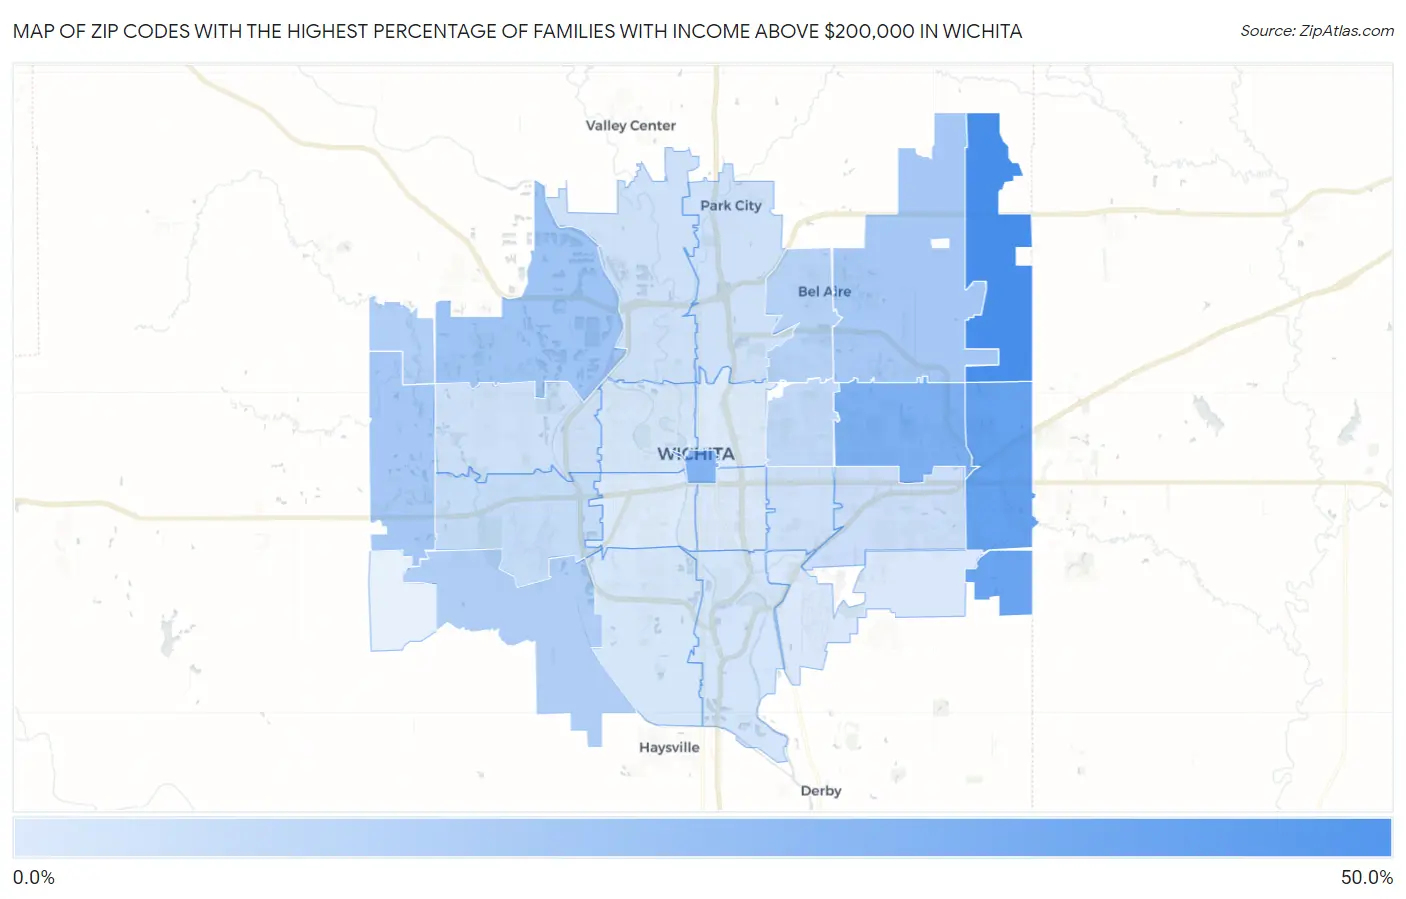
Map of Zip Codes with the Highest Percentage of Families with Income Above $200,000 in Wichita
0.0%
50.0%
Zip Codes with the Highest Percentage of Families with Income Above $200,000 in Wichita, KS
| Zip Code | Families with Income > $200k | vs State | vs National | |
| 1. | 67228 | 48.6% | 11.1%(+37.5)#5 | 14.8%(+33.8)#734 |
| 2. | 67230 | 37.5% | 11.1%(+26.4)#12 | 14.8%(+22.7)#1,555 |
| 3. | 67232 | 35.3% | 11.1%(+24.2)#17 | 14.8%(+20.5)#1,811 |
| 4. | 67206 | 29.6% | 11.1%(+18.5)#26 | 14.8%(+14.8)#2,575 |
| 5. | 67202 | 28.0% | 11.1%(+16.9)#28 | 14.8%(+13.2)#2,871 |
| 6. | 67205 | 18.2% | 11.1%(+7.10)#59 | 14.8%(+3.40)#5,490 |
| 7. | 67226 | 16.2% | 11.1%(+5.10)#67 | 14.8%(+1.40)#6,350 |
| 8. | 67235 | 16.0% | 11.1%(+4.90)#68 | 14.8%(+1.20)#6,451 |
| 9. | 67215 | 12.9% | 11.1%(+1.80)#91 | 14.8%(-1.90)#8,314 |
| 10. | 67223 | 12.1% | 11.1%(+1.000)#104 | 14.8%(-2.70)#8,944 |
| 11. | 67220 | 11.2% | 11.1%(+0.100)#116 | 14.8%(-3.60)#9,631 |
| 12. | 67208 | 8.0% | 11.1%(-3.10)#199 | 14.8%(-6.80)#13,192 |
| 13. | 67209 | 6.4% | 11.1%(-4.70)#259 | 14.8%(-8.40)#15,718 |
| 14. | 67207 | 5.3% | 11.1%(-5.80)#306 | 14.8%(-9.50)#17,795 |
| 15. | 67219 | 4.2% | 11.1%(-6.90)#355 | 14.8%(-10.6)#20,025 |
| 16. | 67212 | 4.0% | 11.1%(-7.10)#369 | 14.8%(-10.8)#20,387 |
| 17. | 67218 | 3.6% | 11.1%(-7.50)#390 | 14.8%(-11.2)#21,251 |
| 18. | 67204 | 3.6% | 11.1%(-7.50)#391 | 14.8%(-11.2)#21,252 |
| 19. | 67216 | 2.4% | 11.1%(-8.70)#438 | 14.8%(-12.4)#23,704 |
| 20. | 67217 | 2.3% | 11.1%(-8.80)#442 | 14.8%(-12.5)#23,896 |
| 21. | 67203 | 2.1% | 11.1%(-9.00)#452 | 14.8%(-12.7)#24,275 |
| 22. | 67211 | 0.70% | 11.1%(-10.4)#511 | 14.8%(-14.1)#26,468 |
| 23. | 67210 | 0.70% | 11.1%(-10.4)#512 | 14.8%(-14.1)#26,473 |
| 24. | 67213 | 0.50% | 11.1%(-10.6)#526 | 14.8%(-14.3)#26,707 |
| 25. | 67214 | 0.20% | 11.1%(-10.9)#530 | 14.8%(-14.6)#26,953 |
1
Common Questions
What are the Top 10 Zip Codes with the Highest Percentage of Families with Income Above $200,000 in Wichita, KS?
Top 10 Zip Codes with the Highest Percentage of Families with Income Above $200,000 in Wichita, KS are:
What zip code has the Highest Percentage of Families with Income Above $200,000 in Wichita, KS?
67228 has the Highest Percentage of Families with Income Above $200,000 in Wichita, KS with 48.6%.
What is the Percentage of Families with Income Above $200,000 in Wichita, KS?
Percentage of Families with Income Above $200,000 in Wichita is 8.3%.
What is the Percentage of Families with Income Above $200,000 in Kansas?
Percentage of Families with Income Above $200,000 in Kansas is 11.1%.
What is the Percentage of Families with Income Above $200,000 in the United States?
Percentage of Families with Income Above $200,000 in the United States is 14.8%.