Zip Codes with the Highest Percentage of Households Without a Vehicle in Wichita, KS
RELATED REPORTS & OPTIONS
Households without a Cars
Wichita
Compare Zip Codes
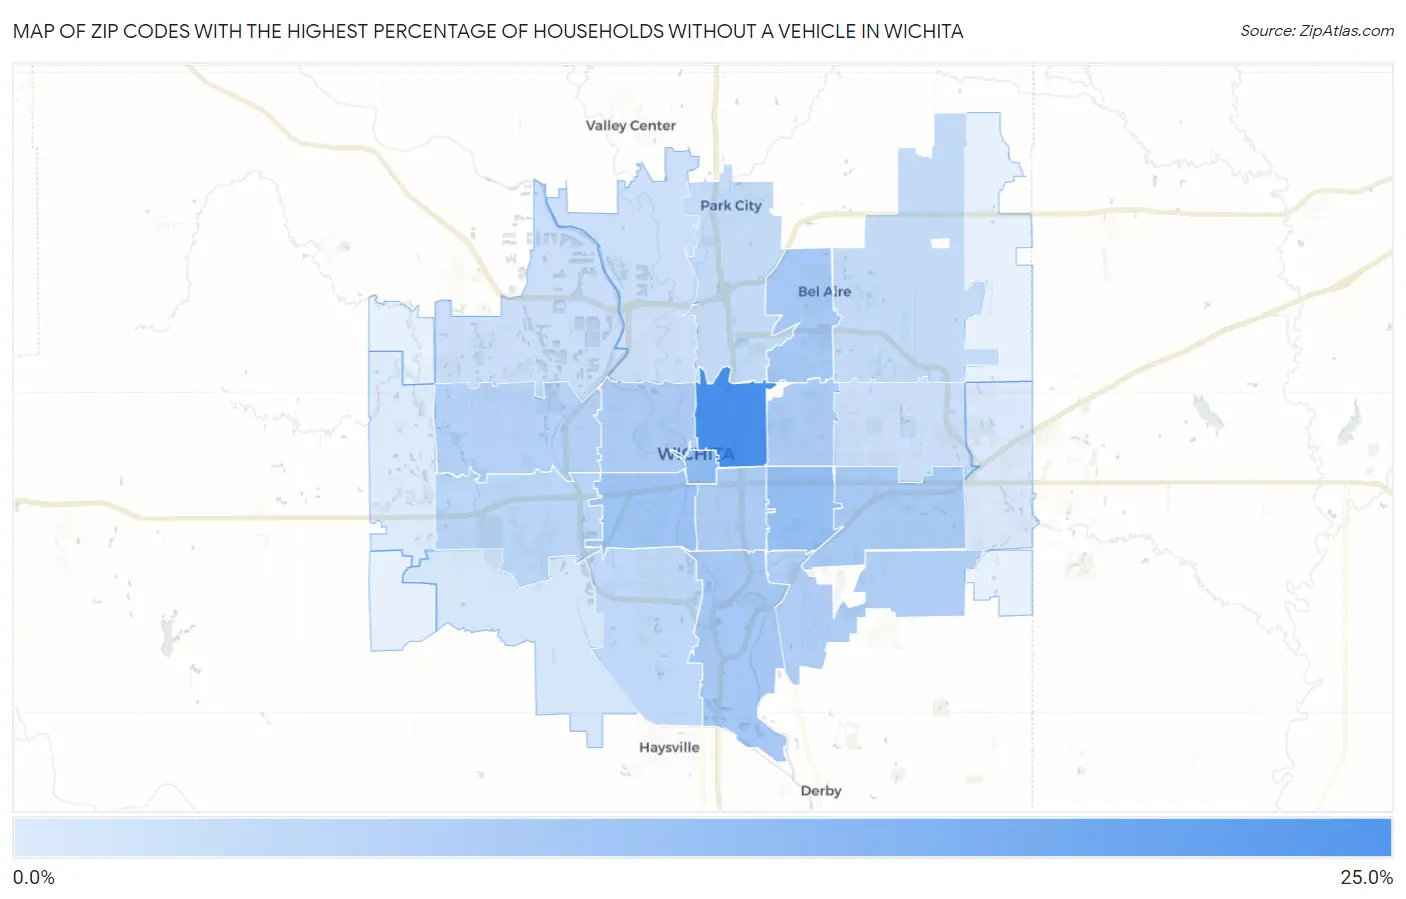
Map of Zip Codes with the Highest Percentage of Households Without a Vehicle in Wichita
0.0%
25.0%
Zip Codes with the Highest Percentage of Households Without a Vehicle in Wichita, KS
| Zip Code | Housholds Without a Car | vs State | vs National | |
| 1. | 67214 | 22.5% | 5.1%(+17.4)#7 | 8.3%(+14.2)#1,260 |
| 2. | 67202 | 11.3% | 5.1%(+6.20)#26 | 8.3%(+3.00)#3,976 |
| 3. | 67218 | 10.4% | 5.1%(+5.30)#33 | 8.3%(+2.10)#4,538 |
| 4. | 67213 | 9.1% | 5.1%(+4.00)#51 | 8.3%(+0.800)#5,631 |
| 5. | 67216 | 8.2% | 5.1%(+3.10)#66 | 8.3%(-0.100)#6,664 |
| 6. | 67220 | 8.0% | 5.1%(+2.90)#69 | 8.3%(-0.300)#6,946 |
| 7. | 67207 | 7.8% | 5.1%(+2.70)#75 | 8.3%(-0.500)#7,235 |
| 8. | 67208 | 7.6% | 5.1%(+2.50)#81 | 8.3%(-0.700)#7,572 |
| 9. | 67211 | 7.3% | 5.1%(+2.20)#92 | 8.3%(-1.00)#8,061 |
| 10. | 67203 | 7.0% | 5.1%(+1.90)#103 | 8.3%(-1.30)#8,550 |
| 11. | 67210 | 6.9% | 5.1%(+1.80)#107 | 8.3%(-1.40)#8,763 |
| 12. | 67212 | 5.9% | 5.1%(+0.800)#136 | 8.3%(-2.40)#10,657 |
| 13. | 67209 | 5.1% | 5.1%(=0.000)#182 | 8.3%(-3.20)#12,667 |
| 14. | 67217 | 4.6% | 5.1%(-0.500)#206 | 8.3%(-3.70)#13,912 |
| 15. | 67219 | 4.0% | 5.1%(-1.10)#239 | 8.3%(-4.30)#15,776 |
| 16. | 67226 | 3.8% | 5.1%(-1.30)#248 | 8.3%(-4.50)#16,374 |
| 17. | 67206 | 3.0% | 5.1%(-2.10)#306 | 8.3%(-5.30)#19,110 |
| 18. | 67205 | 2.9% | 5.1%(-2.20)#311 | 8.3%(-5.40)#19,437 |
| 19. | 67204 | 2.6% | 5.1%(-2.50)#335 | 8.3%(-5.70)#20,436 |
| 20. | 67215 | 1.4% | 5.1%(-3.70)#444 | 8.3%(-6.90)#24,499 |
| 21. | 67230 | 0.90% | 5.1%(-4.20)#487 | 8.3%(-7.40)#25,887 |
| 22. | 67235 | 0.50% | 5.1%(-4.60)#525 | 8.3%(-7.80)#26,802 |
1
Common Questions
What are the Top 10 Zip Codes with the Highest Percentage of Households Without a Vehicle in Wichita, KS?
Top 10 Zip Codes with the Highest Percentage of Households Without a Vehicle in Wichita, KS are:
What zip code has the Highest Percentage of Households Without a Vehicle in Wichita, KS?
67214 has the Highest Percentage of Households Without a Vehicle in Wichita, KS with 22.5%.
What is the Percentage of Households Without a Vehicle in Wichita, KS?
Percentage of Households Without a Vehicle in Wichita is 6.7%.
What is the Percentage of Households Without a Vehicle in Kansas?
Percentage of Households Without a Vehicle in Kansas is 5.1%.
What is the Percentage of Households Without a Vehicle in the United States?
Percentage of Households Without a Vehicle in the United States is 8.3%.