Zip Codes with the Highest Percentage of Self-Employed / Not Incorporated in Wichita, KS

RELATED REPORTS & OPTIONS

Self-Employed / Not Incorporated
Population
Families and Households
Female Fertility
Female Fertility (Unmarried)
Race (Community Size)
Race (Percentage)
Ancestry (Community Size)
AfricanAlaska NativeAmericanApacheArabArapahoArgentineanArmenianAustralianAustrianBangladeshiBarbadianBelgianBhutaneseBlackfeetBolivianBrazilianBritishBulgarianBurmeseCajunCanadianCelticCentral AmericanCentral American IndianCherokeeCheyenneChickasawChileanChippewaChoctawColombianComancheCosta RicanCreekCroatianCubanCzechCzechoslovakianDanishDelawareDominicanDutchDutch West IndianEastern EuropeanEcuadorianEgyptianEnglishEthiopianEuropeanFilipinoFinnishFrenchFrench American IndianFrench CanadianGermanGerman RussianGhanaianGreekGuamanian / ChamorroGuatemalanHaitianHonduranHungarianIcelanderIndian (Asian)IndonesianInupiatIranianIrishIroquoisItalianJamaicanJapaneseJordanianKenyanKiowaKoreanLaotianLebaneseLithuanianLuxembourgerMalaysianMexicanMexican American IndianMongolianMoroccanNative HawaiianNavajoNicaraguanNigerianNorthern EuropeanNorwegianOsageOttawaPakistaniPalestinianPanamanianParaguayanPennsylvania GermanPeruvianPimaPolishPortuguesePotawatomiPuebloPuerto RicanRomanianRussianSalvadoranSamoanScandinavianScotch-IrishScottishSeminoleSiouxSlavicSlovakSloveneSouth AfricanSouth AmericanSpaniardSpanishSpanish AmericanSpanish American IndianSri LankanSubsaharan AfricanSwedishSwissSyrianThaiTrinidadian and TobagonianTurkishUgandanUkrainianVenezuelanWelshWest IndianYugoslavian
Ancestry (Percentage)
AfricanAlaska NativeAmericanApacheArabArapahoArgentineanArmenianAustralianAustrianBangladeshiBarbadianBelgianBhutaneseBlackfeetBolivianBrazilianBritishBulgarianBurmeseCajunCanadianCelticCentral AmericanCentral American IndianCherokeeCheyenneChickasawChileanChippewaChoctawColombianComancheCosta RicanCreekCroatianCubanCzechCzechoslovakianDanishDelawareDominicanDutchDutch West IndianEastern EuropeanEcuadorianEgyptianEnglishEthiopianEuropeanFilipinoFinnishFrenchFrench American IndianFrench CanadianGermanGerman RussianGhanaianGreekGuamanian / ChamorroGuatemalanHaitianHonduranHungarianIcelanderIndian (Asian)IndonesianInupiatIranianIrishIroquoisItalianJamaicanJapaneseJordanianKenyanKiowaKoreanLaotianLebaneseLithuanianLuxembourgerMalaysianMexicanMexican American IndianMongolianMoroccanNative HawaiianNavajoNicaraguanNigerianNorthern EuropeanNorwegianOsageOttawaPakistaniPalestinianPanamanianParaguayanPennsylvania GermanPeruvianPimaPolishPortuguesePotawatomiPuebloPuerto RicanRomanianRussianSalvadoranSamoanScandinavianScotch-IrishScottishSeminoleSiouxSlavicSlovakSloveneSouth AfricanSouth AmericanSpaniardSpanishSpanish AmericanSpanish American IndianSri LankanSubsaharan AfricanSwedishSwissSyrianThaiTrinidadian and TobagonianTurkishUgandanUkrainianVenezuelanWelshWest IndianYugoslavian
Immigrant Origin (Total)
Immigrant Origin (Percentage)
Income
Income (Families)
Income (Households)
Poverty
Poverty (Families)
Unemployment
Employment Occupations
Employment Industries
Employer Class
Commute Time
Commute Means
School Enrollment
Education by Degree Field
Occupancy
Finances
Physical Characteristics
Wichita
Compare Zip Codes
Comparison Subject

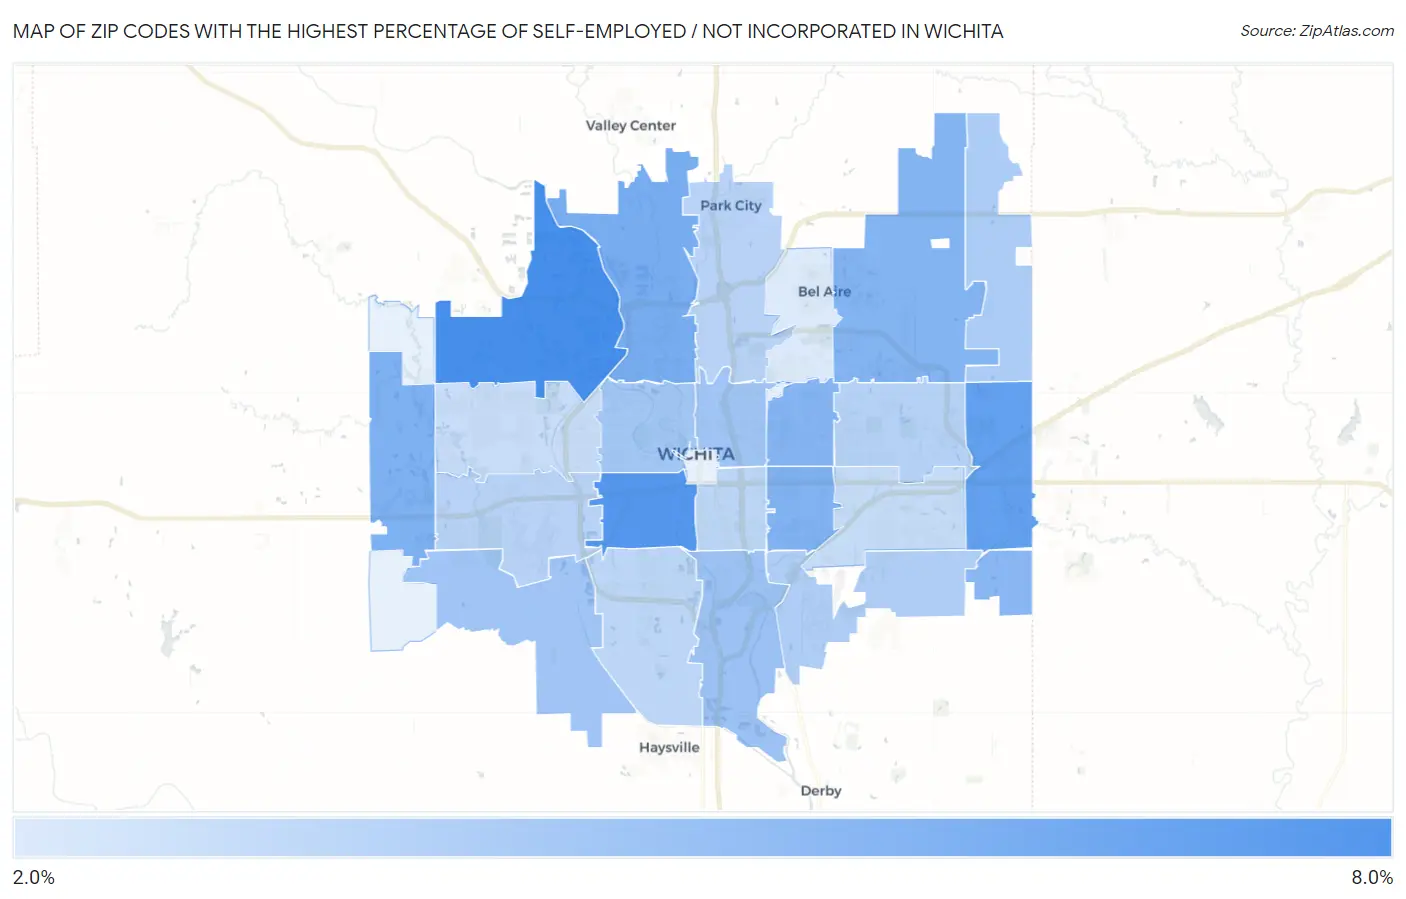
Map of Zip Codes with the Highest Percentage of Self-Employed / Not Incorporated in Wichita

0.0%
8.0%
Zip Codes with the Highest Percentage of Self-Employed / Not Incorporated in Wichita Map

Zip Codes with the Highest Percentage of Self-Employed / Not Incorporated in Wichita, KS

Zip Code % Self-Employed / Not Incorporated vs State vs National
1.672057.8%5.9%(+1.91)#3585.8%(+1.99)#11,057
2.672137.3%5.9%(+1.39)#3795.8%(+1.47)#12,308
3.672306.8%5.9%(+0.906)#4015.8%(+0.991)#13,573
4.672046.0%5.9%(+0.121)#4475.8%(+0.205)#16,005
5.672355.8%5.9%(-0.132)#4595.8%(-0.048)#16,818
6.672185.7%5.9%(-0.242)#4675.8%(-0.158)#17,203
7.672265.6%5.9%(-0.260)#4685.8%(-0.176)#17,256
8.672085.5%5.9%(-0.414)#4815.8%(-0.330)#17,823
9.672325.3%5.9%(-0.567)#4885.8%(-0.482)#18,383
10.672164.8%5.9%(-1.11)#5235.8%(-1.03)#20,458
11.672144.5%5.9%(-1.38)#5425.8%(-1.30)#21,506
12.672154.5%5.9%(-1.40)#5435.8%(-1.32)#21,584
13.672034.5%5.9%(-1.42)#5465.8%(-1.34)#21,657
14.672284.1%5.9%(-1.79)#5755.8%(-1.71)#23,025
15.672104.1%5.9%(-1.83)#5775.8%(-1.75)#23,158
16.672063.8%5.9%(-2.08)#5865.8%(-2.00)#24,019
17.672093.7%5.9%(-2.16)#5875.8%(-2.08)#24,288
18.672193.7%5.9%(-2.21)#5925.8%(-2.12)#24,431
19.672113.6%5.9%(-2.35)#5975.8%(-2.26)#24,840
20.672173.5%5.9%(-2.36)#5985.8%(-2.27)#24,866
21.672073.2%5.9%(-2.70)#6085.8%(-2.62)#25,887
22.672123.1%5.9%(-2.81)#6145.8%(-2.72)#26,134
23.672202.4%5.9%(-3.51)#6295.8%(-3.42)#27,595

Common Questions

What are the Top 10 Zip Codes with the Highest Percentage of Self-Employed / Not Incorporated in Wichita, KS?
Top 10 Zip Codes with the Highest Percentage of Self-Employed / Not Incorporated in Wichita, KS are:
#1
7.8%
#2
7.3%
#3
6.8%
#4
6.0%
#5
5.8%
#6
5.7%
#7
5.6%
#8
5.5%
#9
5.3%
#10
4.8%
What zip code has the Highest Percentage of Self-Employed / Not Incorporated in Wichita, KS?
67205 has the Highest Percentage of Self-Employed / Not Incorporated in Wichita, KS with 7.8%.
What is the Percentage of Self-Employed / Not Incorporated in Wichita, KS?
Percentage of Self-Employed / Not Incorporated in Wichita is 4.5%.
What is the Percentage of Self-Employed / Not Incorporated in Kansas?
Percentage of Self-Employed / Not Incorporated in Kansas is 5.9%.
What is the Percentage of Self-Employed / Not Incorporated in the United States?
Percentage of Self-Employed / Not Incorporated in the United States is 5.8%.