Scandinavian vs Immigrants from Peru Wage/Income Gap
COMPARE
Scandinavian
Immigrants from Peru
Wage/Income Gap
Wage/Income Gap Comparison
Scandinavians
Immigrants from Peru
29.1%
WAGE/INCOME GAP
0.0/ 100
METRIC RATING
328th/ 347
METRIC RANK
25.1%
WAGE/INCOME GAP
82.6/ 100
METRIC RATING
149th/ 347
METRIC RANK
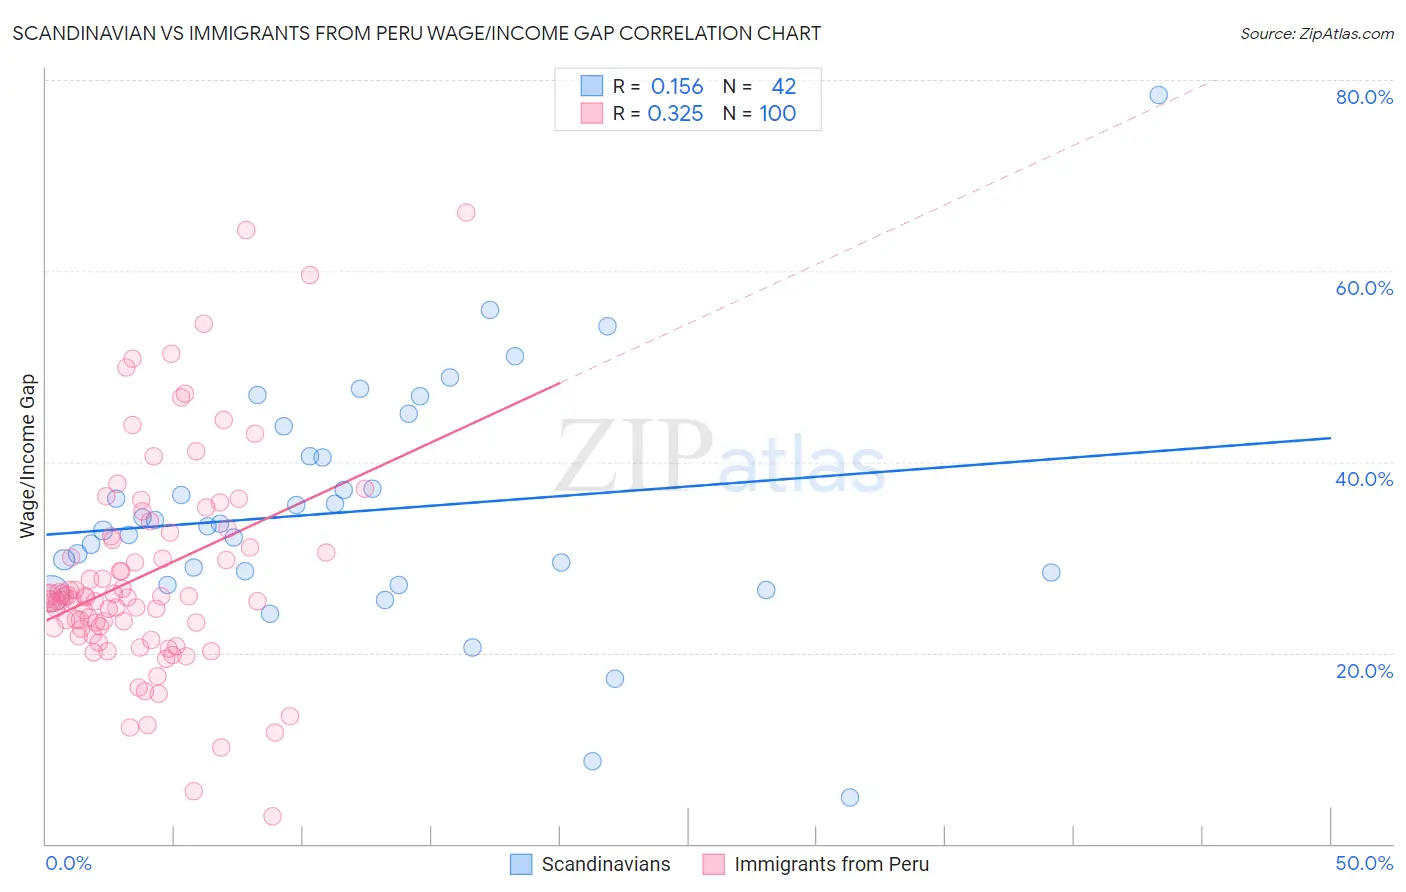
Scandinavian vs Immigrants from Peru Wage/Income Gap Correlation Chart
The statistical analysis conducted on geographies consisting of 471,744,681 people shows a poor positive correlation between the proportion of Scandinavians and wage/income gap percentage in the United States with a correlation coefficient (R) of 0.156 and weighted average of 29.1%. Similarly, the statistical analysis conducted on geographies consisting of 328,741,739 people shows a mild positive correlation between the proportion of Immigrants from Peru and wage/income gap percentage in the United States with a correlation coefficient (R) of 0.325 and weighted average of 25.1%, a difference of 15.9%.
Wage/Income Gap Correlation Summary
| Measurement | Scandinavian | Immigrants from Peru |
| Minimum | 4.8% | 2.9% |
| Maximum | 78.5% | 66.2% |
| Range | 73.7% | 63.3% |
| Mean | 34.9% | 28.2% |
| Median | 33.4% | 25.8% |
| Interquartile 25% (IQ1) | 28.4% | 22.6% |
| Interquartile 75% (IQ3) | 40.6% | 32.4% |
| Interquartile Range (IQR) | 12.2% | 9.8% |
| Standard Deviation (Sample) | 12.8% | 11.3% |
| Standard Deviation (Population) | 12.6% | 11.2% |
Similar Demographics by Wage/Income Gap
Demographics Similar to Scandinavians by Wage/Income Gap
In terms of wage/income gap, the demographic groups most similar to Scandinavians are Immigrants from Iran (29.1%, a difference of 0.060%), Scottish (29.1%, a difference of 0.14%), Immigrants from Belgium (29.0%, a difference of 0.17%), Hungarian (29.0%, a difference of 0.24%), and German (29.2%, a difference of 0.24%).
| Demographics | Rating | Rank | Wage/Income Gap |
| Welsh | 0.1 /100 | #321 | Tragic 28.9% |
| Immigrants | Singapore | 0.1 /100 | #322 | Tragic 28.9% |
| Norwegians | 0.1 /100 | #323 | Tragic 29.0% |
| Croatians | 0.0 /100 | #324 | Tragic 29.0% |
| Hungarians | 0.0 /100 | #325 | Tragic 29.0% |
| Immigrants | Belgium | 0.0 /100 | #326 | Tragic 29.0% |
| Immigrants | Iran | 0.0 /100 | #327 | Tragic 29.1% |
| Scandinavians | 0.0 /100 | #328 | Tragic 29.1% |
| Scottish | 0.0 /100 | #329 | Tragic 29.1% |
| Germans | 0.0 /100 | #330 | Tragic 29.2% |
| Czechs | 0.0 /100 | #331 | Tragic 29.2% |
| Immigrants | South Central Asia | 0.0 /100 | #332 | Tragic 29.3% |
| Europeans | 0.0 /100 | #333 | Tragic 29.4% |
| Swedes | 0.0 /100 | #334 | Tragic 29.4% |
| Immigrants | Taiwan | 0.0 /100 | #335 | Tragic 29.5% |
Demographics Similar to Immigrants from Peru by Wage/Income Gap
In terms of wage/income gap, the demographic groups most similar to Immigrants from Peru are Immigrants (25.1%, a difference of 0.040%), Taiwanese (25.1%, a difference of 0.12%), Iroquois (25.1%, a difference of 0.15%), Uruguayan (25.2%, a difference of 0.16%), and Malaysian (25.0%, a difference of 0.28%).
| Demographics | Rating | Rank | Wage/Income Gap |
| Afghans | 88.1 /100 | #142 | Excellent 24.9% |
| Immigrants | Uganda | 88.0 /100 | #143 | Excellent 24.9% |
| Chippewa | 86.9 /100 | #144 | Excellent 25.0% |
| Comanche | 85.2 /100 | #145 | Excellent 25.0% |
| South Americans | 85.2 /100 | #146 | Excellent 25.0% |
| Malaysians | 84.9 /100 | #147 | Excellent 25.0% |
| Iroquois | 83.9 /100 | #148 | Excellent 25.1% |
| Immigrants | Peru | 82.6 /100 | #149 | Excellent 25.1% |
| Immigrants | Immigrants | 82.3 /100 | #150 | Excellent 25.1% |
| Taiwanese | 81.6 /100 | #151 | Excellent 25.1% |
| Uruguayans | 81.3 /100 | #152 | Excellent 25.2% |
| Blackfeet | 78.1 /100 | #153 | Good 25.2% |
| Immigrants | Northern Africa | 78.1 /100 | #154 | Good 25.2% |
| Immigrants | Vietnam | 77.7 /100 | #155 | Good 25.2% |
| Immigrants | Mexico | 76.4 /100 | #156 | Good 25.3% |