Zip Codes with the Highest Percentage of Population Employed in Office & Administration in Noblesville, IN
RELATED REPORTS & OPTIONS
Office & Administration
Noblesville
Compare Zip Codes
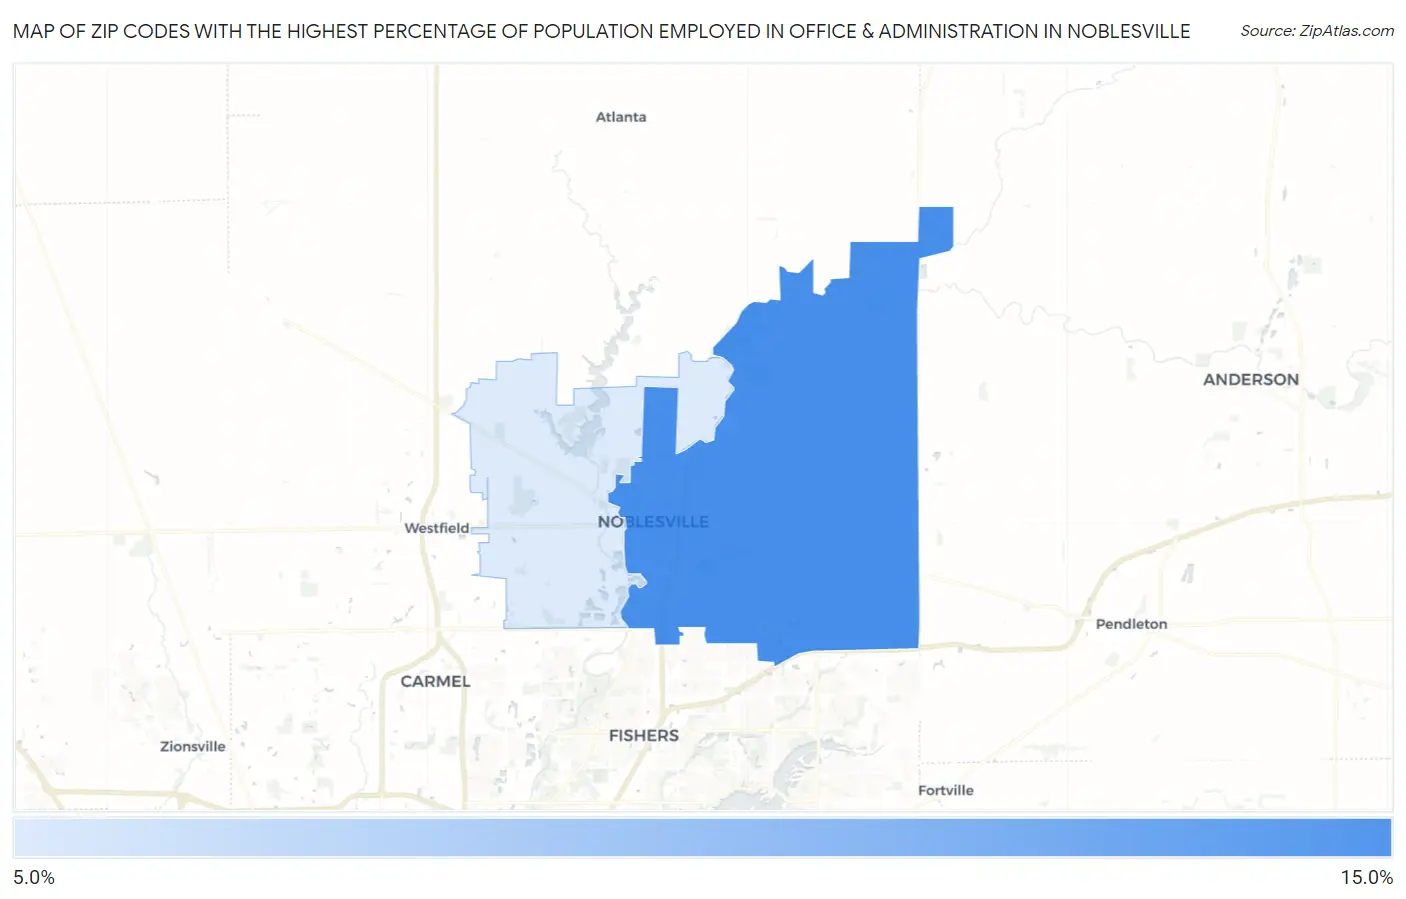
Map of Zip Codes with the Highest Percentage of Population Employed in Office & Administration in Noblesville
0.0%
15.0%
Zip Codes with the Highest Percentage of Population Employed in Office & Administration in Noblesville, IN
| Zip Code | % Employed | vs State | vs National | |
| 1. | 46060 | 12.2% | 11.0%(+1.21)#206 | 10.9%(+1.34)#10,154 |
| 2. | 46062 | 11.6% | 11.0%(+0.651)#260 | 10.9%(+0.783)#11,821 |
1
Common Questions
What are the Top Zip Codes with the Highest Percentage of Population Employed in Office & Administration in Noblesville, IN?
Top Zip Codes with the Highest Percentage of Population Employed in Office & Administration in Noblesville, IN are:
What zip code has the Highest Percentage of Population Employed in Office & Administration in Noblesville, IN?
46060 has the Highest Percentage of Population Employed in Office & Administration in Noblesville, IN with 12.2%.
What is the Percentage of Population Employed in Office & Administration in Noblesville, IN?
Percentage of Population Employed in Office & Administration in Noblesville is 11.8%.
What is the Percentage of Population Employed in Office & Administration in Indiana?
Percentage of Population Employed in Office & Administration in Indiana is 11.0%.
What is the Percentage of Population Employed in Office & Administration in the United States?
Percentage of Population Employed in Office & Administration in the United States is 10.9%.