Zip Codes with the Highest Percentage of Families with Income Above $200,000 in Hawaii
RELATED REPORTS & OPTIONS
Family Income | $200k+
Hawaii
Compare Zip Codes
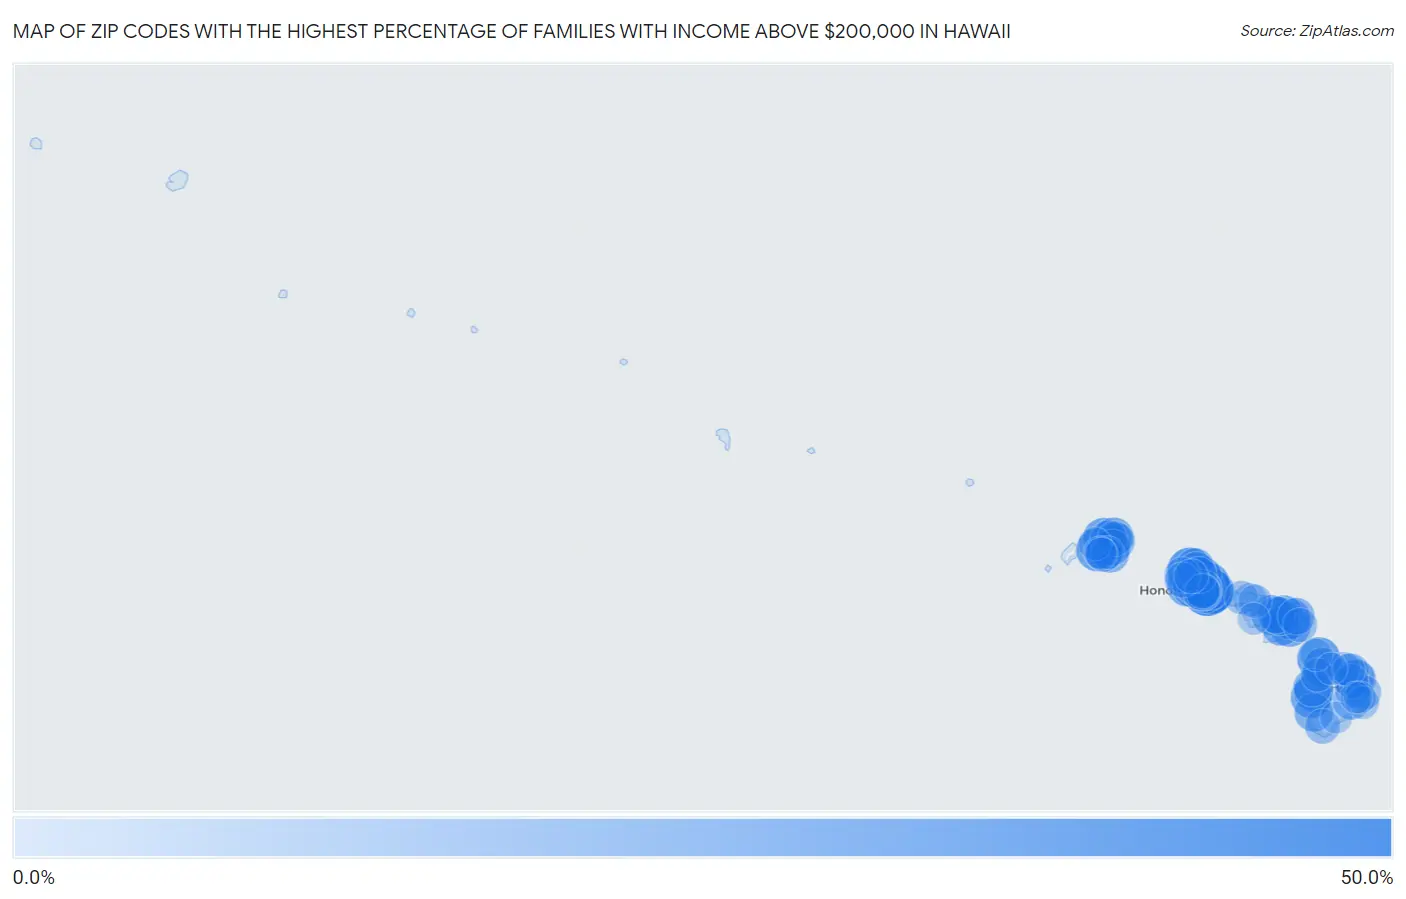
Map of Zip Codes with the Highest Percentage of Families with Income Above $200,000 in Hawaii
0.0%
50.0%
Zip Codes with the Highest Percentage of Families with Income Above $200,000 in Hawaii
| Zip Code | Families with Income > $200k | vs State | vs National | |
| 1. | 96821 | 40.9% | 18.9%(+22.0)#1 | 14.8%(+26.1)#1,236 |
| 2. | 96825 | 32.2% | 18.9%(+13.3)#2 | 14.8%(+17.4)#2,200 |
| 3. | 96712 | 30.8% | 18.9%(+11.9)#3 | 14.8%(+16.0)#2,405 |
| 4. | 96734 | 29.0% | 18.9%(+10.1)#4 | 14.8%(+14.2)#2,662 |
| 5. | 96816 | 27.9% | 18.9%(+9.00)#5 | 14.8%(+13.1)#2,874 |
| 6. | 96701 | 27.2% | 18.9%(+8.30)#6 | 14.8%(+12.4)#3,013 |
| 7. | 96744 | 27.1% | 18.9%(+8.20)#7 | 14.8%(+12.3)#3,030 |
| 8. | 96755 | 26.9% | 18.9%(+8.00)#8 | 14.8%(+12.1)#3,071 |
| 9. | 96822 | 26.4% | 18.9%(+7.50)#9 | 14.8%(+11.6)#3,158 |
| 10. | 96796 | 25.8% | 18.9%(+6.90)#10 | 14.8%(+11.0)#3,292 |
| 11. | 96795 | 25.5% | 18.9%(+6.60)#11 | 14.8%(+10.7)#3,352 |
| 12. | 96714 | 24.0% | 18.9%(+5.10)#12 | 14.8%(+9.20)#3,714 |
| 13. | 96750 | 22.4% | 18.9%(+3.50)#13 | 14.8%(+7.60)#4,123 |
| 14. | 96790 | 22.2% | 18.9%(+3.30)#14 | 14.8%(+7.40)#4,162 |
| 15. | 96768 | 22.1% | 18.9%(+3.20)#15 | 14.8%(+7.30)#4,184 |
| 16. | 96730 | 22.0% | 18.9%(+3.10)#16 | 14.8%(+7.20)#4,218 |
| 17. | 96707 | 21.7% | 18.9%(+2.80)#17 | 14.8%(+6.90)#4,292 |
| 18. | 96789 | 21.4% | 18.9%(+2.50)#18 | 14.8%(+6.60)#4,374 |
| 19. | 96813 | 20.9% | 18.9%(+2.00)#19 | 14.8%(+6.10)#4,534 |
| 20. | 96782 | 20.7% | 18.9%(+1.80)#20 | 14.8%(+5.90)#4,599 |
| 21. | 96754 | 20.7% | 18.9%(+1.80)#21 | 14.8%(+5.90)#4,609 |
| 22. | 96761 | 20.3% | 18.9%(+1.40)#22 | 14.8%(+5.50)#4,724 |
| 23. | 96819 | 20.0% | 18.9%(+1.10)#23 | 14.8%(+5.20)#4,804 |
| 24. | 96725 | 19.8% | 18.9%(+0.900)#24 | 14.8%(+5.00)#4,894 |
| 25. | 96706 | 19.4% | 18.9%(+0.500)#25 | 14.8%(+4.60)#4,994 |
| 26. | 96779 | 19.3% | 18.9%(+0.400)#26 | 14.8%(+4.50)#5,062 |
| 27. | 96743 | 18.9% | 18.9%(=0.000)#27 | 14.8%(+4.10)#5,200 |
| 28. | 96741 | 18.5% | 18.9%(-0.400)#28 | 14.8%(+3.70)#5,373 |
| 29. | 96753 | 18.4% | 18.9%(-0.500)#29 | 14.8%(+3.60)#5,409 |
| 30. | 96797 | 17.6% | 18.9%(-1.30)#30 | 14.8%(+2.80)#5,715 |
| 31. | 96731 | 17.3% | 18.9%(-1.60)#31 | 14.8%(+2.50)#5,871 |
| 32. | 96704 | 17.2% | 18.9%(-1.70)#32 | 14.8%(+2.40)#5,903 |
| 33. | 96762 | 17.1% | 18.9%(-1.80)#33 | 14.8%(+2.30)#5,954 |
| 34. | 96732 | 16.8% | 18.9%(-2.10)#34 | 14.8%(+2.00)#6,074 |
| 35. | 96817 | 16.7% | 18.9%(-2.20)#35 | 14.8%(+1.90)#6,107 |
| 36. | 96740 | 16.6% | 18.9%(-2.30)#36 | 14.8%(+1.80)#6,158 |
| 37. | 96756 | 16.1% | 18.9%(-2.80)#37 | 14.8%(+1.30)#6,413 |
| 38. | 96818 | 15.5% | 18.9%(-3.40)#38 | 14.8%(+0.700)#6,677 |
| 39. | 96815 | 15.0% | 18.9%(-3.90)#39 | 14.8%(+0.200)#6,982 |
| 40. | 96814 | 15.0% | 18.9%(-3.90)#40 | 14.8%(+0.200)#6,985 |
| 41. | 96793 | 14.7% | 18.9%(-4.20)#41 | 14.8%(-0.100)#7,153 |
| 42. | 96746 | 14.2% | 18.9%(-4.70)#42 | 14.8%(-0.600)#7,434 |
| 43. | 96783 | 14.0% | 18.9%(-4.90)#43 | 14.8%(-0.800)#7,566 |
| 44. | 96785 | 13.9% | 18.9%(-5.00)#44 | 14.8%(-0.900)#7,614 |
| 45. | 96708 | 13.7% | 18.9%(-5.20)#45 | 14.8%(-1.10)#7,749 |
| 46. | 96722 | 13.7% | 18.9%(-5.20)#46 | 14.8%(-1.10)#7,775 |
| 47. | 96728 | 13.1% | 18.9%(-5.80)#47 | 14.8%(-1.70)#8,187 |
| 48. | 96717 | 12.9% | 18.9%(-6.00)#48 | 14.8%(-1.90)#8,322 |
| 49. | 96766 | 12.4% | 18.9%(-6.50)#49 | 14.8%(-2.40)#8,659 |
| 50. | 96705 | 11.7% | 18.9%(-7.20)#50 | 14.8%(-3.10)#9,219 |
| 51. | 96791 | 11.4% | 18.9%(-7.50)#51 | 14.8%(-3.40)#9,462 |
| 52. | 96720 | 11.2% | 18.9%(-7.70)#52 | 14.8%(-3.60)#9,609 |
| 53. | 96780 | 10.9% | 18.9%(-8.00)#53 | 14.8%(-3.90)#9,970 |
| 54. | 96792 | 10.3% | 18.9%(-8.60)#54 | 14.8%(-4.50)#10,469 |
| 55. | 96703 | 10.1% | 18.9%(-8.80)#55 | 14.8%(-4.70)#10,735 |
| 56. | 96772 | 9.9% | 18.9%(-9.00)#56 | 14.8%(-4.90)#10,940 |
| 57. | 96749 | 9.5% | 18.9%(-9.40)#57 | 14.8%(-5.30)#11,323 |
| 58. | 96826 | 8.7% | 18.9%(-10.2)#58 | 14.8%(-6.10)#12,264 |
| 59. | 96781 | 8.5% | 18.9%(-10.4)#59 | 14.8%(-6.30)#12,591 |
| 60. | 96786 | 8.3% | 18.9%(-10.6)#60 | 14.8%(-6.50)#12,764 |
| 61. | 96713 | 7.9% | 18.9%(-11.0)#61 | 14.8%(-6.90)#13,408 |
| 62. | 96757 | 6.9% | 18.9%(-12.0)#62 | 14.8%(-7.90)#14,982 |
| 63. | 96729 | 6.7% | 18.9%(-12.2)#63 | 14.8%(-8.10)#15,309 |
| 64. | 96748 | 6.6% | 18.9%(-12.3)#64 | 14.8%(-8.20)#15,429 |
| 65. | 96776 | 6.4% | 18.9%(-12.5)#65 | 14.8%(-8.40)#15,813 |
| 66. | 96738 | 6.3% | 18.9%(-12.6)#66 | 14.8%(-8.50)#15,935 |
| 67. | 96764 | 5.9% | 18.9%(-13.0)#67 | 14.8%(-8.90)#16,762 |
| 68. | 96765 | 5.8% | 18.9%(-13.1)#68 | 14.8%(-9.00)#16,934 |
| 69. | 96778 | 5.7% | 18.9%(-13.2)#69 | 14.8%(-9.10)#17,002 |
| 70. | 96752 | 5.7% | 18.9%(-13.2)#70 | 14.8%(-9.10)#17,063 |
| 71. | 96719 | 5.0% | 18.9%(-13.9)#71 | 14.8%(-9.80)#18,540 |
| 72. | 96727 | 4.5% | 18.9%(-14.4)#72 | 14.8%(-10.3)#19,444 |
| 73. | 96747 | 4.4% | 18.9%(-14.5)#73 | 14.8%(-10.4)#19,695 |
| 74. | 96760 | 4.0% | 18.9%(-14.9)#74 | 14.8%(-10.8)#20,488 |
| 75. | 96763 | 3.9% | 18.9%(-15.0)#75 | 14.8%(-10.9)#20,715 |
| 76. | 96716 | 3.9% | 18.9%(-15.0)#76 | 14.8%(-10.9)#20,735 |
| 77. | 96777 | 3.6% | 18.9%(-15.3)#77 | 14.8%(-11.2)#21,362 |
| 78. | 96771 | 3.4% | 18.9%(-15.5)#78 | 14.8%(-11.4)#21,713 |
1
Common Questions
What are the Top 10 Zip Codes with the Highest Percentage of Families with Income Above $200,000 in Hawaii?
Top 10 Zip Codes with the Highest Percentage of Families with Income Above $200,000 in Hawaii are:
What zip code has the Highest Percentage of Families with Income Above $200,000 in Hawaii?
96821 has the Highest Percentage of Families with Income Above $200,000 in Hawaii with 40.9%.
What is the Percentage of Families with Income Above $200,000 in the State of Hawaii?
Percentage of Families with Income Above $200,000 in Hawaii is 18.9%.
What is the Percentage of Families with Income Above $200,000 in the United States?
Percentage of Families with Income Above $200,000 in the United States is 14.8%.