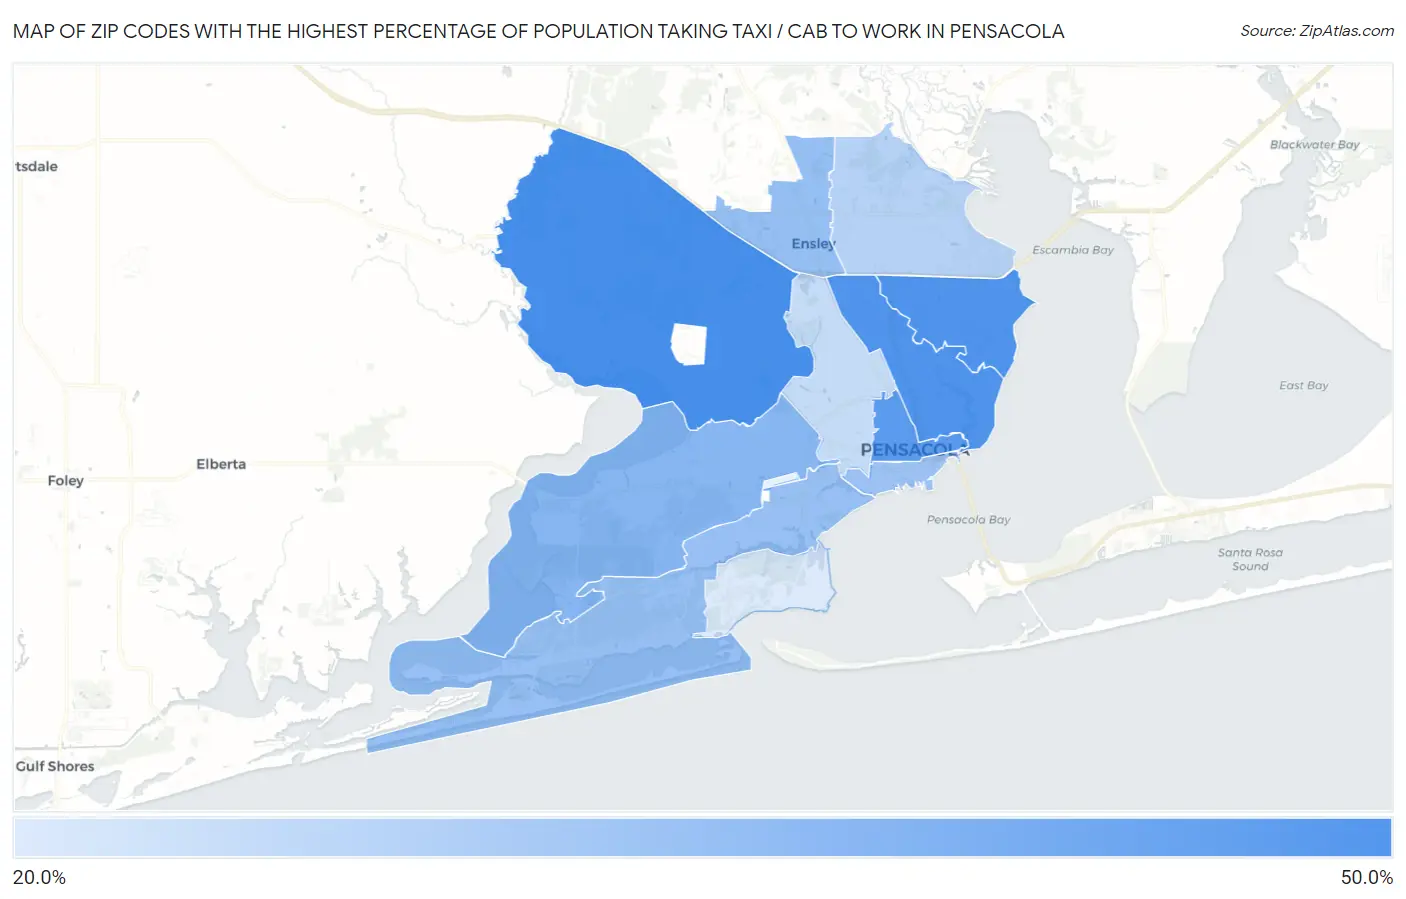
Zip Codes with the Highest Percentage of Population Taking Taxi / Cab to Work in Pensacola, FL
RELATED REPORTS & OPTIONS
Taxi / Cab
Pensacola
Compare Zip Codes
Map of Zip Codes with the Highest Percentage of Population Taking Taxi / Cab to Work in Pensacola
0.0%
50.0%
Zip Codes with the Highest Percentage of Population Taking Taxi / Cab to Work in Pensacola, FL
| Zip Code | % Take Taxi / Cab | vs State | vs National | |
| 1. | 32526 | 42.0% | 39.2%(+2.80)#333 | 38.2%(+3.80)#5,717 |
| 2. | 32503 | 40.7% | 39.2%(+1.50)#366 | 38.2%(+2.50)#6,283 |
| 3. | 32504 | 40.6% | 39.2%(+1.40)#369 | 38.2%(+2.40)#6,336 |
| 4. | 32501 | 39.1% | 39.2%(-0.100)#410 | 38.2%(+0.900)#7,044 |
| 5. | 32506 | 32.7% | 39.2%(-6.50)#576 | 38.2%(-5.50)#9,890 |
| 6. | 32534 | 30.9% | 39.2%(-8.30)#612 | 38.2%(-7.30)#10,573 |
| 7. | 32507 | 30.7% | 39.2%(-8.50)#619 | 38.2%(-7.50)#10,668 |
| 8. | 32502 | 30.1% | 39.2%(-9.10)#628 | 38.2%(-8.10)#10,892 |
| 9. | 32514 | 26.5% | 39.2%(-12.7)#694 | 38.2%(-11.7)#11,948 |
| 10. | 32505 | 24.5% | 39.2%(-14.7)#717 | 38.2%(-13.7)#12,362 |
| 11. | 32508 | 21.6% | 39.2%(-17.6)#734 | 38.2%(-16.6)#12,834 |
1
Common Questions
What are the Top 10 Zip Codes with the Highest Percentage of Population Taking Taxi / Cab to Work in Pensacola, FL?
Top 10 Zip Codes with the Highest Percentage of Population Taking Taxi / Cab to Work in Pensacola, FL are:
What zip code has the Highest Percentage of Population Taking Taxi / Cab to Work in Pensacola, FL?
32526 has the Highest Percentage of Population Taking Taxi / Cab to Work in Pensacola, FL with 42.0%.
What is the Percentage of Population Taking Taxi / Cab to Work in Pensacola, FL?
Percentage of Population Taking Taxi / Cab to Work in Pensacola is 39.1%.
What is the Percentage of Population Taking Taxi / Cab to Work in Florida?
Percentage of Population Taking Taxi / Cab to Work in Florida is 39.2%.
What is the Percentage of Population Taking Taxi / Cab to Work in the United States?
Percentage of Population Taking Taxi / Cab to Work in the United States is 38.2%.