Zip Codes with the Highest Percentage of Population with a Degree in Communications in Pensacola, FL

RELATED REPORTS & OPTIONS

Communications
Population
Families and Households
Female Fertility
Female Fertility (Unmarried)
Race (Community Size)
Race (Percentage)
Ancestry (Community Size)
AfricanAlbanianAmericanApacheArabArgentineanArmenianAustralianAustrianBahamianBangladeshiBarbadianBelgianBelizeanBhutaneseBlackfeetBrazilianBritishBurmeseCajunCanadianCelticCentral AmericanCentral American IndianCherokeeChileanChippewaChoctawColombianCosta RicanCreeCreekCroatianCubanCzechCzechoslovakianDanishDominicanDutchEastern EuropeanEcuadorianEnglishEstonianEuropeanFinnishFrenchFrench American IndianFrench CanadianGermanGerman RussianGreekGuamanian / ChamorroGuatemalanGuyaneseHaitianHonduranHoumaHungarianIcelanderIndian (Asian)IranianIrishIroquoisItalianJamaicanJapaneseJordanianKenyanKoreanLaotianLatvianLebaneseLithuanianMacedonianMalaysianMalteseMexicanMexican American IndianMoroccanNative HawaiianNavajoNicaraguanNigerianNorthern EuropeanNorwegianOsagePakistaniPanamanianParaguayanPennsylvania GermanPeruvianPolishPortuguesePuebloPuerto RicanRomanianRussianSalvadoranSamoanScandinavianScotch-IrishScottishSeminoleSerbianSiouxSlavicSlovakSloveneSouth AfricanSouth AmericanSouth American IndianSpaniardSpanishSri LankanSubsaharan AfricanSwedishSwissSyrianThaiTurkishUkrainianVenezuelanVietnameseWelshWest IndianYaquiYugoslavian
Ancestry (Percentage)
AfricanAlbanianAmericanApacheArabArgentineanArmenianAustralianAustrianBahamianBangladeshiBarbadianBelgianBelizeanBhutaneseBlackfeetBrazilianBritishBurmeseCajunCanadianCelticCentral AmericanCentral American IndianCherokeeChileanChippewaChoctawColombianCosta RicanCreeCreekCroatianCubanCzechCzechoslovakianDanishDominicanDutchEastern EuropeanEcuadorianEnglishEstonianEuropeanFinnishFrenchFrench American IndianFrench CanadianGermanGerman RussianGreekGuamanian / ChamorroGuatemalanGuyaneseHaitianHonduranHoumaHungarianIcelanderIndian (Asian)IranianIrishIroquoisItalianJamaicanJapaneseJordanianKenyanKoreanLaotianLatvianLebaneseLithuanianMacedonianMalaysianMalteseMexicanMexican American IndianMoroccanNative HawaiianNavajoNicaraguanNigerianNorthern EuropeanNorwegianOsagePakistaniPanamanianParaguayanPennsylvania GermanPeruvianPolishPortuguesePuebloPuerto RicanRomanianRussianSalvadoranSamoanScandinavianScotch-IrishScottishSeminoleSerbianSiouxSlavicSlovakSloveneSouth AfricanSouth AmericanSouth American IndianSpaniardSpanishSri LankanSubsaharan AfricanSwedishSwissSyrianThaiTurkishUkrainianVenezuelanVietnameseWelshWest IndianYaquiYugoslavian
Immigrant Origin (Total)
Immigrant Origin (Percentage)
Income
Income (Families)
Income (Households)
Poverty
Poverty (Families)
Unemployment
Employment Occupations
Employment Industries
Employer Class
Commute Time
Commute Means
School Enrollment
Education by Degree Field
Occupancy
Finances
Physical Characteristics
Pensacola
States
Florida Cities
Altamonte SpringsApopkaBoca RatonBonita SpringsBoynton BeachBradentonBrandonBrooksvilleCape CoralCasselberryClearwaterClermontCocoaCoral SpringsCrestviewCrystal RiverDade CityDavenportDaytona BeachDeerfield BeachDefuniak SpringsDelandDelray BeachDeltonaDunnellonEdgewaterEnglewoodEustisFort LauderdaleFort MyersFort PierceFort Walton BeachGainesvilleGulf BreezeHialeahHolidayHollywoodHomesteadHomosassaHudsonInvernessJacksonvilleJupiterKissimmeeLake CityLake WalesLake WorthLakelandLand O LakesLargoLeesburgLehigh AcresLive OakLongwoodLutzMelbourneMerritt IslandMiamiMiami BeachMiltonNaplesNew Port RicheyNew Smyrna BeachNorth Fort MyersNorth PortOcalaOkeechobeeOpa LockaOrange ParkOrlandoOrmond BeachOviedoPalm BayPalm Beach GardensPalm CoastPalm HarborPanama CityPanama City BeachPensacolaPerryPinellas ParkPlant CityPompano BeachPort CharlottePort OrangePort Saint LuciePunta GordaQuincyRaifordRiverviewSaint AugustineSaint CloudSaint PetersburgSanfordSarasotaSebastianSebringSeminoleSpring HillStuartTallahasseeTampaTarpon SpringsThe VillagesTitusvilleValricoVeniceVero BeachWesley ChapelWest Palm BeachWinter HavenWinter ParkZephyrhills
Compare Zip Codes
Comparison Subject

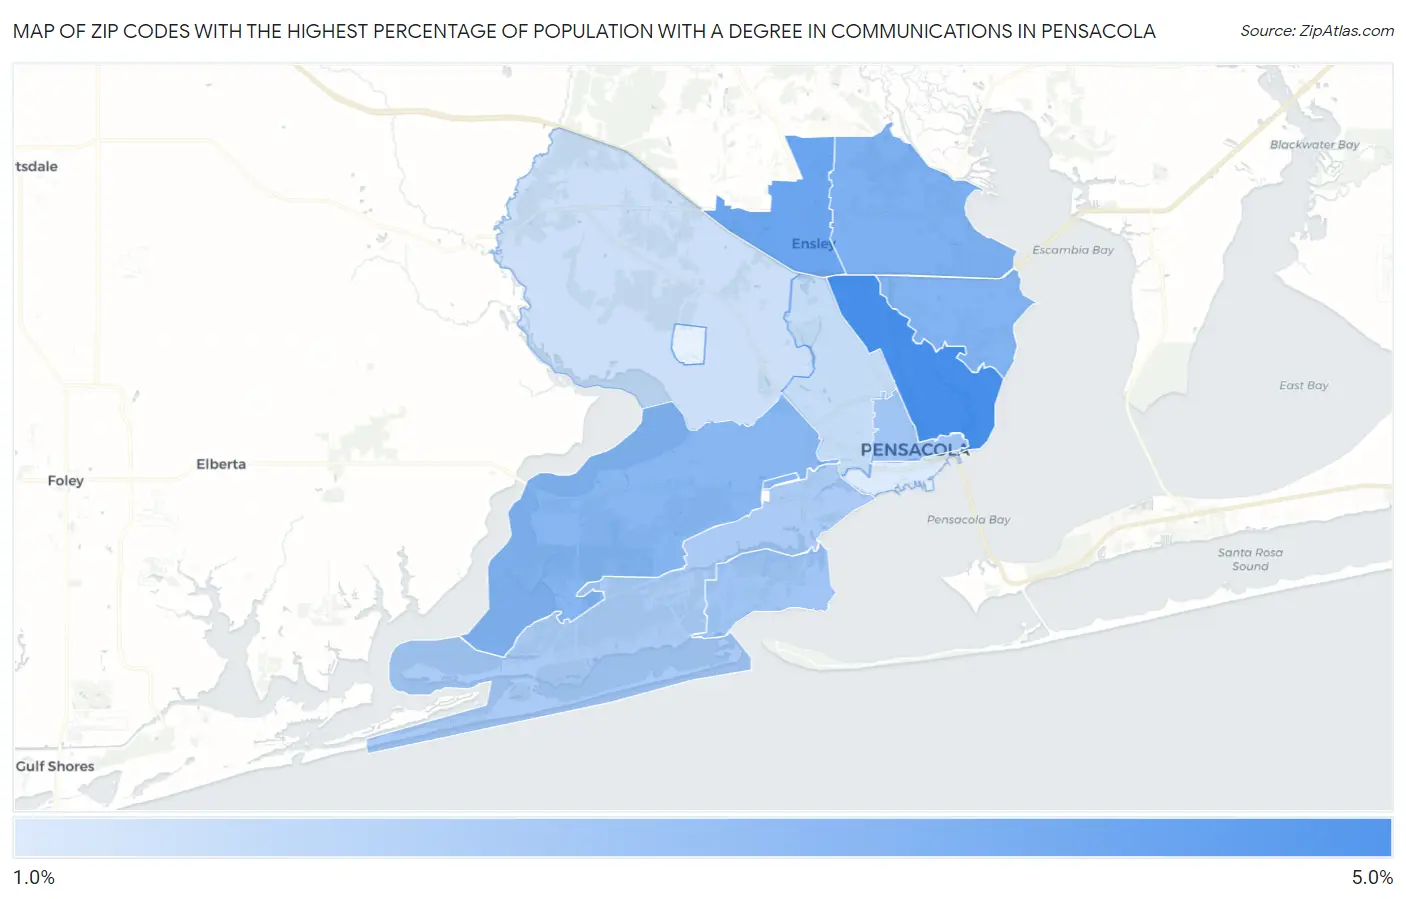
Map of Zip Codes with the Highest Percentage of Population with a Degree in Communications in Pensacola

0.0%
5.0%
Zip Codes with the Highest Percentage of Population with a Degree in Communications in Pensacola Map

Zip Codes with the Highest Percentage of Population with a Degree in Communications in Pensacola, FL

Zip Code % Graduates vs State vs National
1.325034.9%3.9%(+1.00)#2144.1%(+0.792)#5,864
2.325344.0%3.9%(+0.063)#3654.1%(-0.148)#8,608
3.325143.6%3.9%(-0.320)#4224.1%(-0.531)#9,933
4.325043.5%3.9%(-0.423)#4414.1%(-0.634)#10,327
5.325063.3%3.9%(-0.606)#4724.1%(-0.817)#11,000
6.325113.3%3.9%(-0.646)#4834.1%(-0.856)#11,137
7.325082.7%3.9%(-1.24)#5784.1%(-1.45)#13,474
8.325012.7%3.9%(-1.25)#5794.1%(-1.46)#13,500
9.325072.5%3.9%(-1.44)#6204.1%(-1.65)#14,197
10.325051.8%3.9%(-2.12)#7414.1%(-2.33)#16,560
11.325261.6%3.9%(-2.29)#7644.1%(-2.50)#17,071
12.325021.2%3.9%(-2.68)#8004.1%(-2.89)#18,245

Common Questions

What are the Top 10 Zip Codes with the Highest Percentage of Population with a Degree in Communications in Pensacola, FL?
Top 10 Zip Codes with the Highest Percentage of Population with a Degree in Communications in Pensacola, FL are:
#1
4.9%
#2
4.0%
#3
3.6%
#4
3.5%
#5
3.3%
#6
3.3%
#7
2.7%
#8
2.7%
#9
2.5%
#10
1.8%
What zip code has the Highest Percentage of Population with a Degree in Communications in Pensacola, FL?
32503 has the Highest Percentage of Population with a Degree in Communications in Pensacola, FL with 4.9%.
What is the Percentage of Population with a Degree in Communications in Pensacola, FL?
Percentage of Population with a Degree in Communications in Pensacola is 3.9%.
What is the Percentage of Population with a Degree in Communications in Florida?
Percentage of Population with a Degree in Communications in Florida is 3.9%.
What is the Percentage of Population with a Degree in Communications in the United States?
Percentage of Population with a Degree in Communications in the United States is 4.1%.