Zip Codes with the Highest Percentage of Population Employed in Accommodation & Food Services in Englewood, FL
RELATED REPORTS & OPTIONS
Accommodation & Food Services
Englewood
Compare Zip Codes
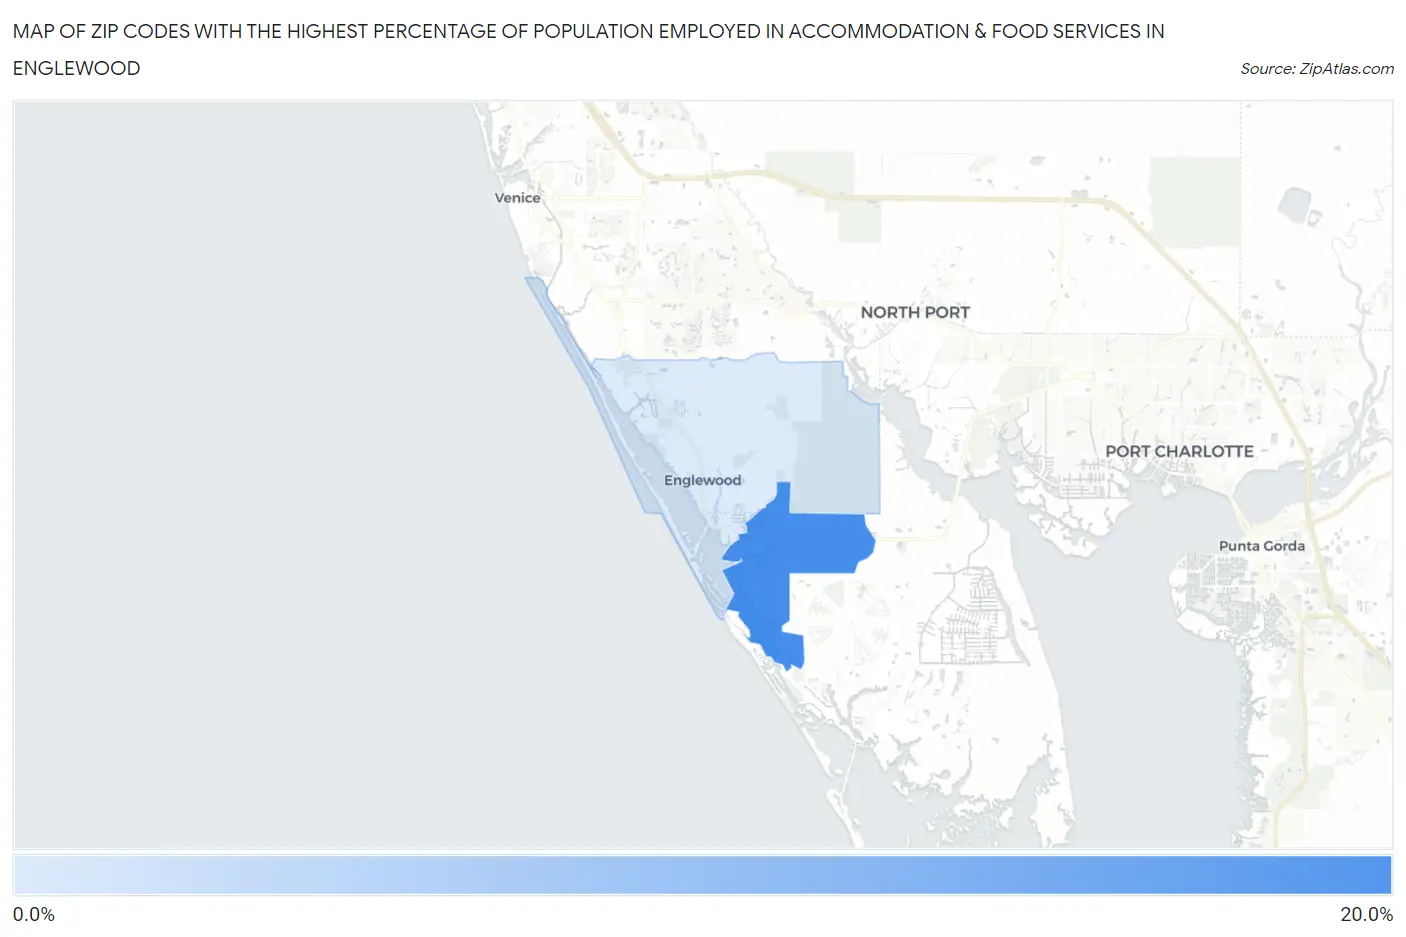
Map of Zip Codes with the Highest Percentage of Population Employed in Accommodation & Food Services in Englewood
0.0%
20.0%
Zip Codes with the Highest Percentage of Population Employed in Accommodation & Food Services in Englewood, FL
| Zip Code | % Employed | vs State | vs National | |
| 1. | 34224 | 15.2% | 8.4%(+6.79)#58 | 6.9%(+8.28)#1,633 |
| 2. | 34223 | 4.9% | 8.4%(-3.46)#808 | 6.9%(-1.97)#17,139 |
1
Common Questions
What are the Top Zip Codes with the Highest Percentage of Population Employed in Accommodation & Food Services in Englewood, FL?
Top Zip Codes with the Highest Percentage of Population Employed in Accommodation & Food Services in Englewood, FL are:
What zip code has the Highest Percentage of Population Employed in Accommodation & Food Services in Englewood, FL?
34224 has the Highest Percentage of Population Employed in Accommodation & Food Services in Englewood, FL with 15.2%.
What is the Percentage of Population Employed in Accommodation & Food Services in Englewood, FL?
Percentage of Population Employed in Accommodation & Food Services in Englewood is 5.4%.
What is the Percentage of Population Employed in Accommodation & Food Services in Florida?
Percentage of Population Employed in Accommodation & Food Services in Florida is 8.4%.
What is the Percentage of Population Employed in Accommodation & Food Services in the United States?
Percentage of Population Employed in Accommodation & Food Services in the United States is 6.9%.