Zip Codes with the Highest Percentage of Population Employed in Agriculture, Fishing & Hunting in Clermont, FL
RELATED REPORTS & OPTIONS
Agriculture, Fishing & Hunting
Clermont
Compare Zip Codes
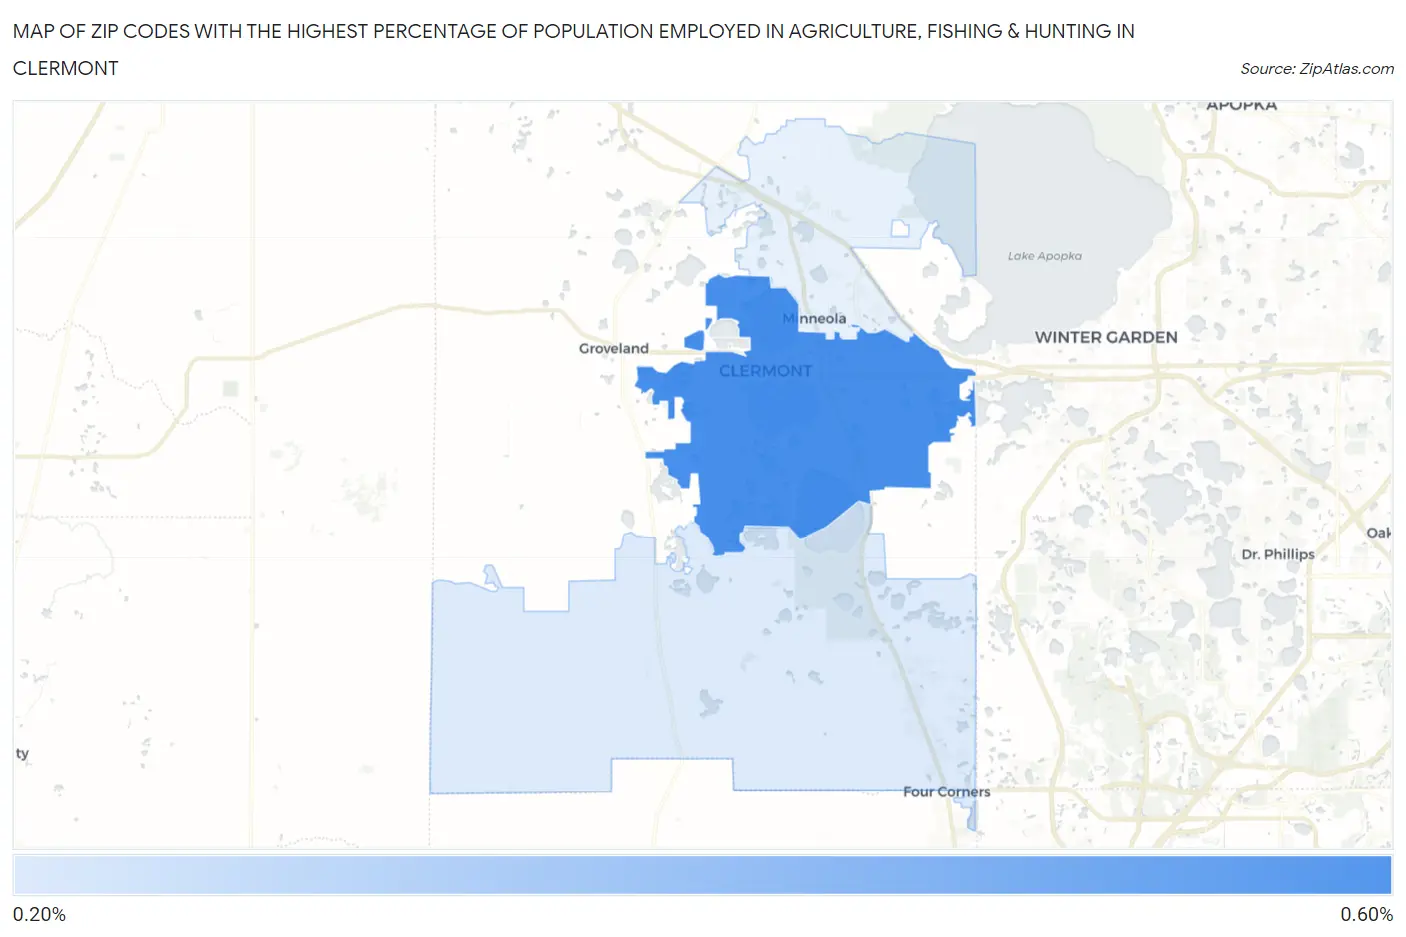
Map of Zip Codes with the Highest Percentage of Population Employed in Agriculture, Fishing & Hunting in Clermont
0.0%
0.60%
Zip Codes with the Highest Percentage of Population Employed in Agriculture, Fishing & Hunting in Clermont, FL
| Zip Code | % Employed | vs State | vs National | |
| 1. | 34711 | 0.53% | 0.75%(-0.211)#408 | 1.2%(-0.664)#18,978 |
| 2. | 34714 | 0.25% | 0.75%(-0.495)#583 | 1.2%(-0.949)#21,757 |
1
Common Questions
What are the Top Zip Codes with the Highest Percentage of Population Employed in Agriculture, Fishing & Hunting in Clermont, FL?
Top Zip Codes with the Highest Percentage of Population Employed in Agriculture, Fishing & Hunting in Clermont, FL are:
What zip code has the Highest Percentage of Population Employed in Agriculture, Fishing & Hunting in Clermont, FL?
34711 has the Highest Percentage of Population Employed in Agriculture, Fishing & Hunting in Clermont, FL with 0.53%.
What is the Percentage of Population Employed in Agriculture, Fishing & Hunting in Clermont, FL?
Percentage of Population Employed in Agriculture, Fishing & Hunting in Clermont is 0.31%.
What is the Percentage of Population Employed in Agriculture, Fishing & Hunting in Florida?
Percentage of Population Employed in Agriculture, Fishing & Hunting in Florida is 0.75%.
What is the Percentage of Population Employed in Agriculture, Fishing & Hunting in the United States?
Percentage of Population Employed in Agriculture, Fishing & Hunting in the United States is 1.2%.