Zimbabwean vs Chippewa Single Mother Households

COMPARE

Zimbabwean
Race
Ancestry
AfghanAfricanAlaska NativeAlaskan AthabascanAlbanianAleutAlsatianAmericanApacheArabArapahoArgentineanArmenianAssyrian/Chaldean/SyriacAustralianAustrianBahamianBangladeshiBarbadianBasqueBelgianBelizeanBermudanBhutaneseBlackfeetBolivianBrazilianBritishBritish West IndianBulgarianBurmeseCajunCambodianCanadianCape VerdeanCarpatho RusynCelticCentral AmericanCentral American IndianCherokeeCheyenneChickasawChileanChineseChoctawColombianColvilleComancheCosta RicanCreeCreekCroatianCrowCubanCypriotCzechCzechoslovakianDanishDelawareDominicanDutchDutch West IndianEastern EuropeanEcuadorianEgyptianEnglishEstonianEthiopianEuropeanFijianFilipinoFinnishFrenchFrench American IndianFrench CanadianGermanGerman RussianGhanaianGreekGuamanian/ChamorroGuatemalanGuyaneseHaitianHmongHonduranHopiHoumaHungarianIcelanderIndian (Asian)IndonesianInupiatIranianIraqiIrishIroquoisIsraeliItalianJamaicanJapaneseJordanianKenyanKiowaKoreanLaotianLatvianLebaneseLiberianLithuanianLumbeeLuxembourgerMacedonianMalaysianMalteseMarshalleseMenomineeMexicanMexican American IndianMongolianMoroccanNative HawaiianNavajoNepaleseNew ZealanderNicaraguanNigerianNorthern EuropeanNorwegianOkinawanOsageOttawaPaiutePakistaniPalestinianPanamanianParaguayanPennsylvania GermanPeruvianPimaPolishPortuguesePotawatomiPuebloPuerto RicanPuget Sound SalishRomanianRussianSalvadoranSamoanScandinavianScotch-IrishScottishSeminoleSenegaleseSerbianShoshoneSierra LeoneanSiouxSlavicSlovakSloveneSomaliSouth AfricanSouth AmericanSouth American IndianSoviet UnionSpaniardSpanishSpanish AmericanSpanish American IndianSri LankanSubsaharan AfricanSudaneseSwedishSwissSyrianTaiwaneseThaiTlingit-HaidaTohono O'OdhamTonganTrinidadian and TobagonianTsimshianTurkishU.S. Virgin IslanderUgandanUkrainianUruguayanUteVenezuelanVietnameseWelshWest IndianYakamaYaquiYugoslavianYumanYup'ikZimbabwean
Immigration
NonimmigrantsImmigrantsAfghanistanAfricaAlbaniaArgentinaArmeniaAsiaAustraliaAustriaBahamasBangladeshBarbadosBelarusBelgiumBelizeBoliviaBosnia and HerzegovinaBrazilBulgariaBurma/MyanmarCabo VerdeCambodiaCameroonCanadaCaribbeanCentral AmericaChileChinaColombiaCongoCosta RicaCroatiaCubaCzechoslovakiaDenmarkDominicaDominican RepublicEastern AfricaEastern AsiaEastern EuropeEcuadorEgyptEl SalvadorEnglandEritreaEthiopiaEuropeFijiFranceGermanyGhanaGreeceGrenadaGuatemalaGuyanaHaitiHondurasHong KongHungaryIndiaIndonesiaIranIraqIrelandIsraelItalyJamaicaJapanJordanKazakhstanKenyaKoreaKuwaitLaosLatin AmericaLatviaLebanonLiberiaLithuaniaMalaysiaMexicoMicronesiaMiddle AfricaMoldovaMoroccoNepalNetherlandsNicaraguaNigeriaNorth AmericaNorth MacedoniaNorthern AfricaNorthern EuropeNorwayOceaniaPakistanPanamaPeruPhilippinesPolandPortugalRomaniaRussiaSaudi ArabiaScotlandSenegalSerbiaSierra LeoneSingaporeSomaliaSouth AfricaSouth AmericaSouth Central AsiaSouth Eastern AsiaSouthern EuropeSpainSri LankaSt. Vincent and the GrenadinesSudanSwedenSwitzerlandSyriaTaiwanThailandTrinidad and TobagoTurkeyUgandaUkraineUruguayUzbekistanVenezuelaVietnamWest IndiesWestern AfricaWestern AsiaWestern EuropeYemenZaireZimbabweAzores
Chippewa
Race
Ancestry
AfghanAfricanAlaska NativeAlaskan AthabascanAlbanianAleutAlsatianAmericanApacheArabArapahoArgentineanArmenianAssyrian/Chaldean/SyriacAustralianAustrianBahamianBangladeshiBarbadianBasqueBelgianBelizeanBermudanBhutaneseBlackfeetBolivianBrazilianBritishBritish West IndianBulgarianBurmeseCajunCambodianCanadianCape VerdeanCarpatho RusynCelticCentral AmericanCentral American IndianCherokeeCheyenneChickasawChileanChineseChippewaChoctawColombianColvilleComancheCosta RicanCreeCreekCroatianCrowCubanCypriotCzechCzechoslovakianDanishDelawareDominicanDutchDutch West IndianEastern EuropeanEcuadorianEgyptianEnglishEstonianEthiopianEuropeanFijianFilipinoFinnishFrenchFrench American IndianFrench CanadianGermanGerman RussianGhanaianGreekGuamanian/ChamorroGuatemalanGuyaneseHaitianHmongHonduranHopiHoumaHungarianIcelanderIndian (Asian)IndonesianInupiatIranianIraqiIrishIroquoisIsraeliItalianJamaicanJapaneseJordanianKenyanKiowaKoreanLaotianLatvianLebaneseLiberianLithuanianLumbeeLuxembourgerMacedonianMalaysianMalteseMarshalleseMenomineeMexicanMexican American IndianMongolianMoroccanNative HawaiianNavajoNepaleseNew ZealanderNicaraguanNigerianNorthern EuropeanNorwegianOkinawanOsageOttawaPaiutePakistaniPalestinianPanamanianParaguayanPennsylvania GermanPeruvianPimaPolishPortuguesePotawatomiPuebloPuerto RicanPuget Sound SalishRomanianRussianSalvadoranSamoanScandinavianScotch-IrishScottishSeminoleSenegaleseSerbianShoshoneSierra LeoneanSiouxSlavicSlovakSloveneSomaliSouth AfricanSouth AmericanSouth American IndianSoviet UnionSpaniardSpanishSpanish AmericanSpanish American IndianSri LankanSubsaharan AfricanSudaneseSwedishSwissSyrianTaiwaneseThaiTlingit-HaidaTohono O'OdhamTonganTrinidadian and TobagonianTsimshianTurkishU.S. Virgin IslanderUgandanUkrainianUruguayanUteVenezuelanVietnameseWelshWest IndianYakamaYaquiYugoslavianYumanYup'ik
Immigration
NonimmigrantsImmigrantsAfghanistanAfricaAlbaniaArgentinaArmeniaAsiaAustraliaAustriaBahamasBangladeshBarbadosBelarusBelgiumBelizeBoliviaBosnia and HerzegovinaBrazilBulgariaBurma/MyanmarCabo VerdeCambodiaCameroonCanadaCaribbeanCentral AmericaChileChinaColombiaCongoCosta RicaCroatiaCubaCzechoslovakiaDenmarkDominicaDominican RepublicEastern AfricaEastern AsiaEastern EuropeEcuadorEgyptEl SalvadorEnglandEritreaEthiopiaEuropeFijiFranceGermanyGhanaGreeceGrenadaGuatemalaGuyanaHaitiHondurasHong KongHungaryIndiaIndonesiaIranIraqIrelandIsraelItalyJamaicaJapanJordanKazakhstanKenyaKoreaKuwaitLaosLatin AmericaLatviaLebanonLiberiaLithuaniaMalaysiaMexicoMicronesiaMiddle AfricaMoldovaMoroccoNepalNetherlandsNicaraguaNigeriaNorth AmericaNorth MacedoniaNorthern AfricaNorthern EuropeNorwayOceaniaPakistanPanamaPeruPhilippinesPolandPortugalRomaniaRussiaSaudi ArabiaScotlandSenegalSerbiaSierra LeoneSingaporeSomaliaSouth AfricaSouth AmericaSouth Central AsiaSouth Eastern AsiaSouthern EuropeSpainSri LankaSt. Vincent and the GrenadinesSudanSwedenSwitzerlandSyriaTaiwanThailandTrinidad and TobagoTurkeyUgandaUkraineUruguayUzbekistanVenezuelaVietnamWest IndiesWestern AfricaWestern AsiaWestern EuropeYemenZaireZimbabweAzores
Single Mother Households
Income
Poverty
Unemployment
Labor Participation
Family Structure
Vehicle Availability
Education Level
Disability

Single Mother Households Comparison

Zimbabweans

Chippewa

Excellent
Tragic
6.1%
SINGLE MOTHER HOUSEHOLDS
80.7/ 100
METRIC RATING
150th/ 347
METRIC RANK
8.0%
SINGLE MOTHER HOUSEHOLDS
0.0/ 100
METRIC RATING
301st/ 347
METRIC RANK

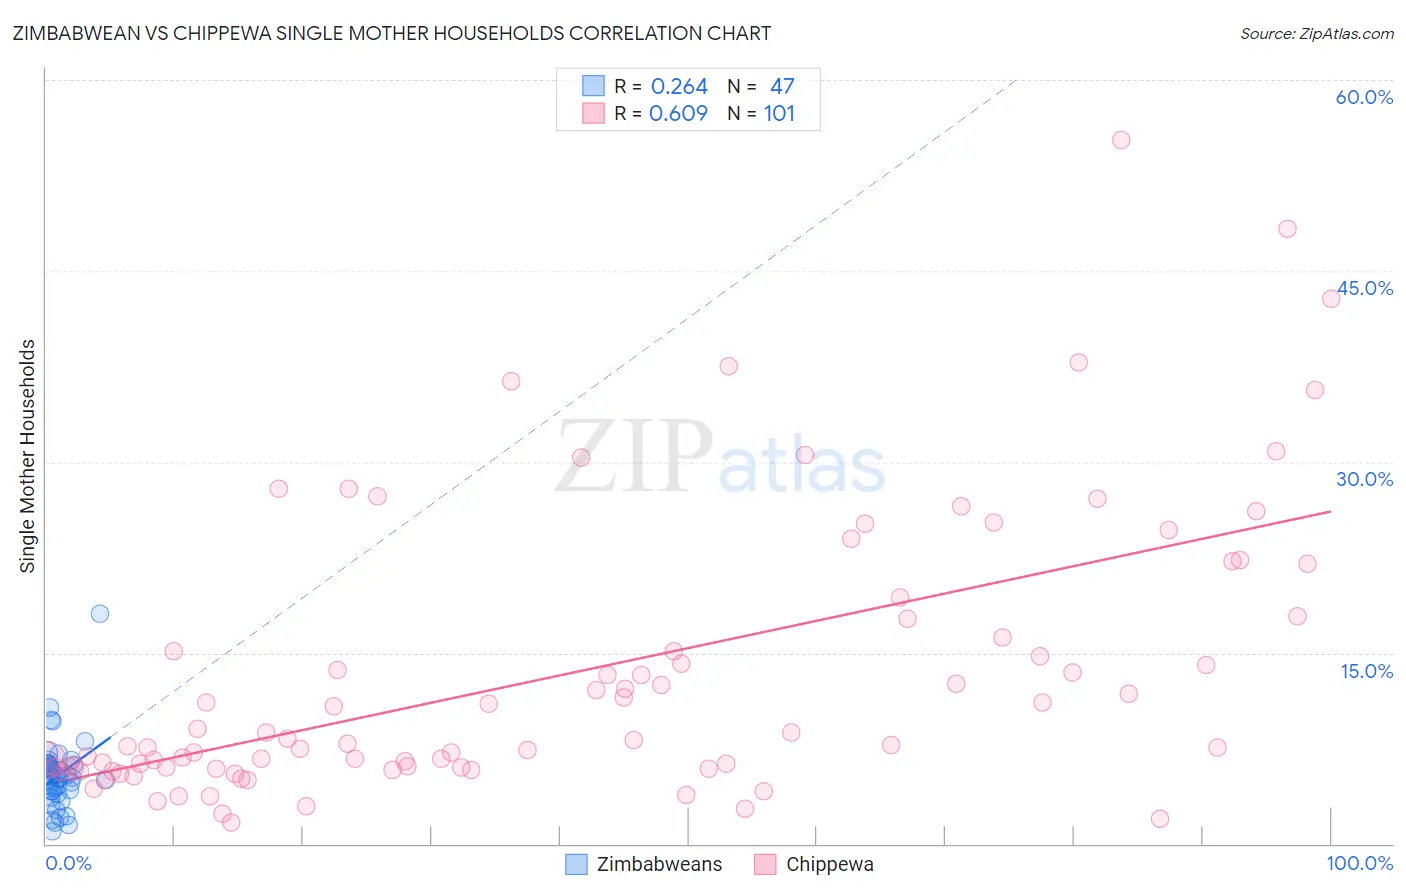
Zimbabwean vs Chippewa Single Mother Households Correlation Chart

The statistical analysis conducted on geographies consisting of 69,178,792 people shows a weak positive correlation between the proportion of Zimbabweans and percentage of single mother households in the United States with a correlation coefficient (R) of 0.264 and weighted average of 6.1%. Similarly, the statistical analysis conducted on geographies consisting of 214,662,896 people shows a significant positive correlation between the proportion of Chippewa and percentage of single mother households in the United States with a correlation coefficient (R) of 0.609 and weighted average of 8.0%, a difference of 31.6%.
Zimbabwean vs Chippewa Single Mother Households

Single Mother Households Correlation Summary

MeasurementZimbabweanChippewa
Minimum0.99%1.7%
Maximum18.1%55.3%
Range17.1%53.6%
Mean5.4%13.4%
Median5.2%8.2%
Interquartile 25% (IQ1)4.1%6.0%
Interquartile 75% (IQ3)6.3%17.8%
Interquartile Range (IQR)2.2%11.8%
Standard Deviation (Sample)2.8%11.0%
Standard Deviation (Population)2.8%11.0%

Similar Demographics by Single Mother Households

Demographics Similar to Zimbabweans by Single Mother Households

In terms of single mother households, the demographic groups most similar to Zimbabweans are Immigrants from Southern Europe (6.1%, a difference of 0.050%), Immigrants from Albania (6.1%, a difference of 0.14%), Scotch-Irish (6.0%, a difference of 0.24%), Pakistani (6.1%, a difference of 0.28%), and Immigrants from Jordan (6.0%, a difference of 0.29%).
DemographicsRating | RankSingle Mother Households
Immigrants | Iraq
84.8
/100
|
#143
Excellent
6.0%
Koreans
84.4
/100
|
#144
Excellent
6.0%
Arabs
84.0
/100
|
#145
Excellent
6.0%
French Canadians
82.6
/100
|
#146
Excellent
6.0%
Immigrants | Jordan
82.3
/100
|
#147
Excellent
6.0%
Scotch-Irish
82.0
/100
|
#148
Excellent
6.0%
Immigrants | Albania
81.5
/100
|
#149
Excellent
6.1%
Zimbabweans
80.7
/100
|
#150
Excellent
6.1%
Immigrants | Southern Europe
80.5
/100
|
#151
Excellent
6.1%
Pakistanis
79.2
/100
|
#152
Good
6.1%
Immigrants | Brazil
78.9
/100
|
#153
Good
6.1%
Immigrants | Philippines
78.5
/100
|
#154
Good
6.1%
Whites/Caucasians
76.5
/100
|
#155
Good
6.1%
Native Hawaiians
75.0
/100
|
#156
Good
6.1%
Chileans
74.2
/100
|
#157
Good
6.1%

Demographics Similar to Chippewa by Single Mother Households

In terms of single mother households, the demographic groups most similar to Chippewa are Immigrants from Ghana (8.0%, a difference of 0.10%), Immigrants from Bahamas (8.0%, a difference of 0.12%), Mexican (8.0%, a difference of 0.16%), Native/Alaskan (8.0%, a difference of 0.56%), and Colville (8.0%, a difference of 0.61%).
DemographicsRating | RankSingle Mother Households
Apache
0.0
/100
|
#294
Tragic
7.9%
Barbadians
0.0
/100
|
#295
Tragic
7.9%
Immigrants | Latin America
0.0
/100
|
#296
Tragic
7.9%
Hispanics or Latinos
0.0
/100
|
#297
Tragic
7.9%
Immigrants | West Indies
0.0
/100
|
#298
Tragic
7.9%
Houma
0.0
/100
|
#299
Tragic
7.9%
Mexicans
0.0
/100
|
#300
Tragic
8.0%
Chippewa
0.0
/100
|
#301
Tragic
8.0%
Immigrants | Ghana
0.0
/100
|
#302
Tragic
8.0%
Immigrants | Bahamas
0.0
/100
|
#303
Tragic
8.0%
Natives/Alaskans
0.0
/100
|
#304
Tragic
8.0%
Colville
0.0
/100
|
#305
Tragic
8.0%
Immigrants | Barbados
0.0
/100
|
#306
Tragic
8.0%
Immigrants | St. Vincent and the Grenadines
0.0
/100
|
#307
Tragic
8.0%
Immigrants | Central America
0.0
/100
|
#308
Tragic
8.1%