Immigrants from Congo vs Chippewa Single Mother Households
COMPARE
Immigrants from Congo
Chippewa
Single Mother Households
Single Mother Households Comparison
Immigrants from Congo
Chippewa
8.1%
SINGLE MOTHER HOUSEHOLDS
0.0/ 100
METRIC RATING
311th/ 347
METRIC RANK
8.0%
SINGLE MOTHER HOUSEHOLDS
0.0/ 100
METRIC RATING
301st/ 347
METRIC RANK
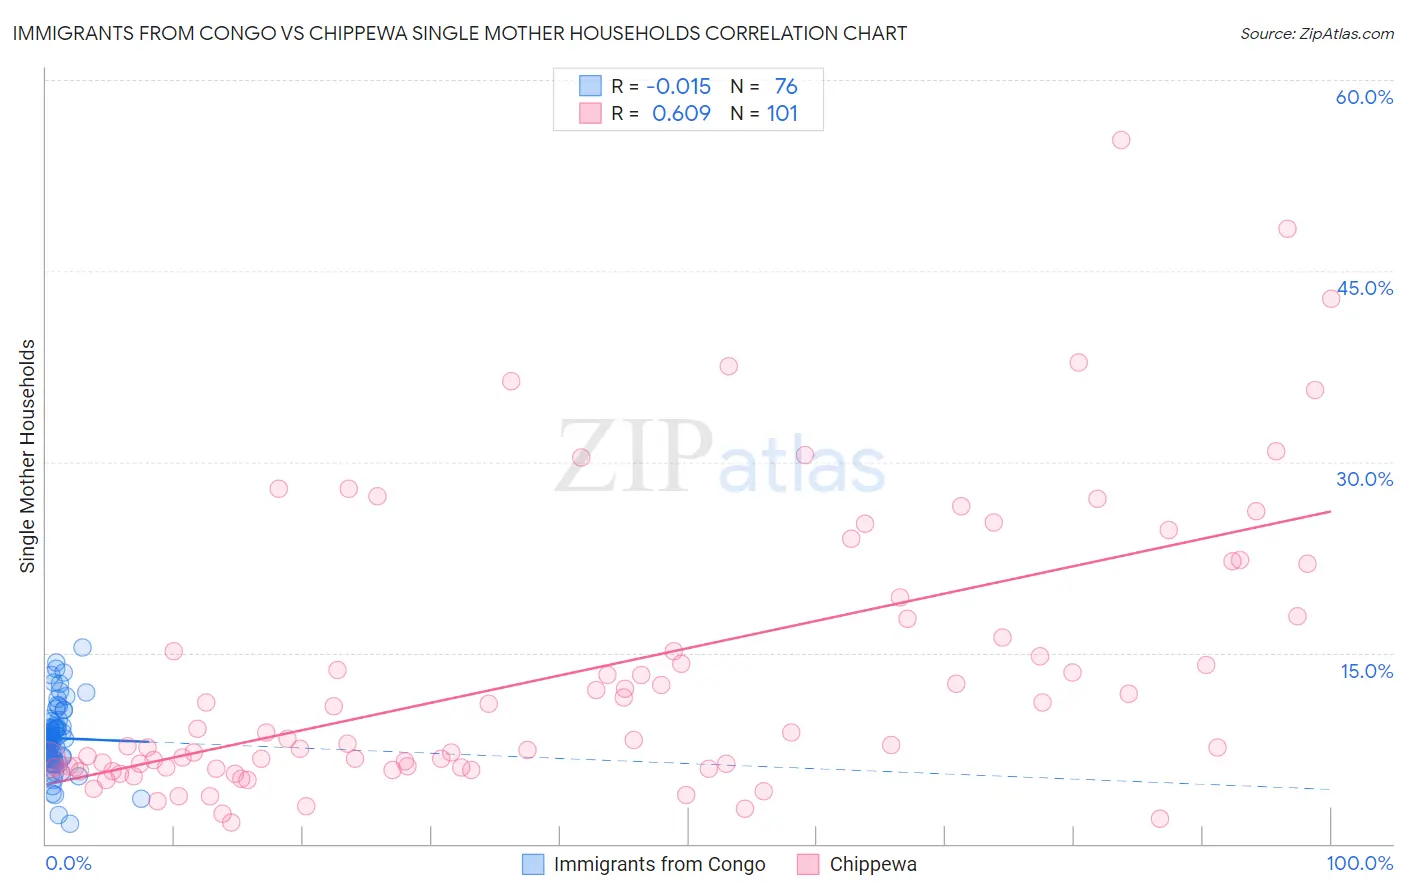
Immigrants from Congo vs Chippewa Single Mother Households Correlation Chart
The statistical analysis conducted on geographies consisting of 92,069,914 people shows no correlation between the proportion of Immigrants from Congo and percentage of single mother households in the United States with a correlation coefficient (R) of -0.015 and weighted average of 8.1%. Similarly, the statistical analysis conducted on geographies consisting of 214,662,896 people shows a significant positive correlation between the proportion of Chippewa and percentage of single mother households in the United States with a correlation coefficient (R) of 0.609 and weighted average of 8.0%, a difference of 1.7%.
Single Mother Households Correlation Summary
| Measurement | Immigrants from Congo | Chippewa |
| Minimum | 1.6% | 1.7% |
| Maximum | 15.4% | 55.3% |
| Range | 13.8% | 53.6% |
| Mean | 8.3% | 13.4% |
| Median | 8.2% | 8.2% |
| Interquartile 25% (IQ1) | 6.7% | 6.0% |
| Interquartile 75% (IQ3) | 9.5% | 17.8% |
| Interquartile Range (IQR) | 2.7% | 11.8% |
| Standard Deviation (Sample) | 2.7% | 11.0% |
| Standard Deviation (Population) | 2.7% | 11.0% |
Demographics Similar to Immigrants from Congo and Chippewa by Single Mother Households
In terms of single mother households, the demographic groups most similar to Immigrants from Congo are Honduran (8.1%, a difference of 0.29%), Bangladeshi (8.1%, a difference of 0.29%), Cheyenne (8.1%, a difference of 0.35%), Immigrants from Grenada (8.2%, a difference of 0.45%), and Immigrants from Mexico (8.2%, a difference of 0.57%). Similarly, the demographic groups most similar to Chippewa are Immigrants from Ghana (8.0%, a difference of 0.10%), Immigrants from Bahamas (8.0%, a difference of 0.12%), Mexican (8.0%, a difference of 0.16%), Native/Alaskan (8.0%, a difference of 0.56%), and Colville (8.0%, a difference of 0.61%).
| Demographics | Rating | Rank | Single Mother Households |
| Immigrants | Latin America | 0.0 /100 | #296 | Tragic 7.9% |
| Hispanics or Latinos | 0.0 /100 | #297 | Tragic 7.9% |
| Immigrants | West Indies | 0.0 /100 | #298 | Tragic 7.9% |
| Houma | 0.0 /100 | #299 | Tragic 7.9% |
| Mexicans | 0.0 /100 | #300 | Tragic 8.0% |
| Chippewa | 0.0 /100 | #301 | Tragic 8.0% |
| Immigrants | Ghana | 0.0 /100 | #302 | Tragic 8.0% |
| Immigrants | Bahamas | 0.0 /100 | #303 | Tragic 8.0% |
| Natives/Alaskans | 0.0 /100 | #304 | Tragic 8.0% |
| Colville | 0.0 /100 | #305 | Tragic 8.0% |
| Immigrants | Barbados | 0.0 /100 | #306 | Tragic 8.0% |
| Immigrants | St. Vincent and the Grenadines | 0.0 /100 | #307 | Tragic 8.0% |
| Immigrants | Central America | 0.0 /100 | #308 | Tragic 8.1% |
| Cheyenne | 0.0 /100 | #309 | Tragic 8.1% |
| Hondurans | 0.0 /100 | #310 | Tragic 8.1% |
| Immigrants | Congo | 0.0 /100 | #311 | Tragic 8.1% |
| Bangladeshis | 0.0 /100 | #312 | Tragic 8.1% |
| Immigrants | Grenada | 0.0 /100 | #313 | Tragic 8.2% |
| Immigrants | Mexico | 0.0 /100 | #314 | Tragic 8.2% |
| Immigrants | Western Africa | 0.0 /100 | #315 | Tragic 8.2% |
| Africans | 0.0 /100 | #316 | Tragic 8.2% |