Zimbabwean vs Chippewa 6th Grade

COMPARE

Zimbabwean
Race
Ancestry
AfghanAfricanAlaska NativeAlaskan AthabascanAlbanianAleutAlsatianAmericanApacheArabArapahoArgentineanArmenianAssyrian/Chaldean/SyriacAustralianAustrianBahamianBangladeshiBarbadianBasqueBelgianBelizeanBermudanBhutaneseBlackfeetBolivianBrazilianBritishBritish West IndianBulgarianBurmeseCajunCambodianCanadianCape VerdeanCarpatho RusynCelticCentral AmericanCentral American IndianCherokeeCheyenneChickasawChileanChineseChoctawColombianColvilleComancheCosta RicanCreeCreekCroatianCrowCubanCypriotCzechCzechoslovakianDanishDelawareDominicanDutchDutch West IndianEastern EuropeanEcuadorianEgyptianEnglishEstonianEthiopianEuropeanFijianFilipinoFinnishFrenchFrench American IndianFrench CanadianGermanGerman RussianGhanaianGreekGuamanian/ChamorroGuatemalanGuyaneseHaitianHmongHonduranHopiHoumaHungarianIcelanderIndian (Asian)IndonesianInupiatIranianIraqiIrishIroquoisIsraeliItalianJamaicanJapaneseJordanianKenyanKiowaKoreanLaotianLatvianLebaneseLiberianLithuanianLumbeeLuxembourgerMacedonianMalaysianMalteseMarshalleseMenomineeMexicanMexican American IndianMongolianMoroccanNative HawaiianNavajoNepaleseNew ZealanderNicaraguanNigerianNorthern EuropeanNorwegianOkinawanOsageOttawaPaiutePakistaniPalestinianPanamanianParaguayanPennsylvania GermanPeruvianPimaPolishPortuguesePotawatomiPuebloPuerto RicanPuget Sound SalishRomanianRussianSalvadoranSamoanScandinavianScotch-IrishScottishSeminoleSenegaleseSerbianShoshoneSierra LeoneanSiouxSlavicSlovakSloveneSomaliSouth AfricanSouth AmericanSouth American IndianSoviet UnionSpaniardSpanishSpanish AmericanSpanish American IndianSri LankanSubsaharan AfricanSudaneseSwedishSwissSyrianTaiwaneseThaiTlingit-HaidaTohono O'OdhamTonganTrinidadian and TobagonianTsimshianTurkishU.S. Virgin IslanderUgandanUkrainianUruguayanUteVenezuelanVietnameseWelshWest IndianYakamaYaquiYugoslavianYumanYup'ikZimbabwean
Immigration
NonimmigrantsImmigrantsAfghanistanAfricaAlbaniaArgentinaArmeniaAsiaAustraliaAustriaBahamasBangladeshBarbadosBelarusBelgiumBelizeBoliviaBosnia and HerzegovinaBrazilBulgariaBurma/MyanmarCabo VerdeCambodiaCameroonCanadaCaribbeanCentral AmericaChileChinaColombiaCongoCosta RicaCroatiaCubaCzechoslovakiaDenmarkDominicaDominican RepublicEastern AfricaEastern AsiaEastern EuropeEcuadorEgyptEl SalvadorEnglandEritreaEthiopiaEuropeFijiFranceGermanyGhanaGreeceGrenadaGuatemalaGuyanaHaitiHondurasHong KongHungaryIndiaIndonesiaIranIraqIrelandIsraelItalyJamaicaJapanJordanKazakhstanKenyaKoreaKuwaitLaosLatin AmericaLatviaLebanonLiberiaLithuaniaMalaysiaMexicoMicronesiaMiddle AfricaMoldovaMoroccoNepalNetherlandsNicaraguaNigeriaNorth AmericaNorth MacedoniaNorthern AfricaNorthern EuropeNorwayOceaniaPakistanPanamaPeruPhilippinesPolandPortugalRomaniaRussiaSaudi ArabiaScotlandSenegalSerbiaSierra LeoneSingaporeSomaliaSouth AfricaSouth AmericaSouth Central AsiaSouth Eastern AsiaSouthern EuropeSpainSri LankaSt. Vincent and the GrenadinesSudanSwedenSwitzerlandSyriaTaiwanThailandTrinidad and TobagoTurkeyUgandaUkraineUruguayUzbekistanVenezuelaVietnamWest IndiesWestern AfricaWestern AsiaWestern EuropeYemenZaireZimbabweAzores
Chippewa
Race
Ancestry
AfghanAfricanAlaska NativeAlaskan AthabascanAlbanianAleutAlsatianAmericanApacheArabArapahoArgentineanArmenianAssyrian/Chaldean/SyriacAustralianAustrianBahamianBangladeshiBarbadianBasqueBelgianBelizeanBermudanBhutaneseBlackfeetBolivianBrazilianBritishBritish West IndianBulgarianBurmeseCajunCambodianCanadianCape VerdeanCarpatho RusynCelticCentral AmericanCentral American IndianCherokeeCheyenneChickasawChileanChineseChippewaChoctawColombianColvilleComancheCosta RicanCreeCreekCroatianCrowCubanCypriotCzechCzechoslovakianDanishDelawareDominicanDutchDutch West IndianEastern EuropeanEcuadorianEgyptianEnglishEstonianEthiopianEuropeanFijianFilipinoFinnishFrenchFrench American IndianFrench CanadianGermanGerman RussianGhanaianGreekGuamanian/ChamorroGuatemalanGuyaneseHaitianHmongHonduranHopiHoumaHungarianIcelanderIndian (Asian)IndonesianInupiatIranianIraqiIrishIroquoisIsraeliItalianJamaicanJapaneseJordanianKenyanKiowaKoreanLaotianLatvianLebaneseLiberianLithuanianLumbeeLuxembourgerMacedonianMalaysianMalteseMarshalleseMenomineeMexicanMexican American IndianMongolianMoroccanNative HawaiianNavajoNepaleseNew ZealanderNicaraguanNigerianNorthern EuropeanNorwegianOkinawanOsageOttawaPaiutePakistaniPalestinianPanamanianParaguayanPennsylvania GermanPeruvianPimaPolishPortuguesePotawatomiPuebloPuerto RicanPuget Sound SalishRomanianRussianSalvadoranSamoanScandinavianScotch-IrishScottishSeminoleSenegaleseSerbianShoshoneSierra LeoneanSiouxSlavicSlovakSloveneSomaliSouth AfricanSouth AmericanSouth American IndianSoviet UnionSpaniardSpanishSpanish AmericanSpanish American IndianSri LankanSubsaharan AfricanSudaneseSwedishSwissSyrianTaiwaneseThaiTlingit-HaidaTohono O'OdhamTonganTrinidadian and TobagonianTsimshianTurkishU.S. Virgin IslanderUgandanUkrainianUruguayanUteVenezuelanVietnameseWelshWest IndianYakamaYaquiYugoslavianYumanYup'ik
Immigration
NonimmigrantsImmigrantsAfghanistanAfricaAlbaniaArgentinaArmeniaAsiaAustraliaAustriaBahamasBangladeshBarbadosBelarusBelgiumBelizeBoliviaBosnia and HerzegovinaBrazilBulgariaBurma/MyanmarCabo VerdeCambodiaCameroonCanadaCaribbeanCentral AmericaChileChinaColombiaCongoCosta RicaCroatiaCubaCzechoslovakiaDenmarkDominicaDominican RepublicEastern AfricaEastern AsiaEastern EuropeEcuadorEgyptEl SalvadorEnglandEritreaEthiopiaEuropeFijiFranceGermanyGhanaGreeceGrenadaGuatemalaGuyanaHaitiHondurasHong KongHungaryIndiaIndonesiaIranIraqIrelandIsraelItalyJamaicaJapanJordanKazakhstanKenyaKoreaKuwaitLaosLatin AmericaLatviaLebanonLiberiaLithuaniaMalaysiaMexicoMicronesiaMiddle AfricaMoldovaMoroccoNepalNetherlandsNicaraguaNigeriaNorth AmericaNorth MacedoniaNorthern AfricaNorthern EuropeNorwayOceaniaPakistanPanamaPeruPhilippinesPolandPortugalRomaniaRussiaSaudi ArabiaScotlandSenegalSerbiaSierra LeoneSingaporeSomaliaSouth AfricaSouth AmericaSouth Central AsiaSouth Eastern AsiaSouthern EuropeSpainSri LankaSt. Vincent and the GrenadinesSudanSwedenSwitzerlandSyriaTaiwanThailandTrinidad and TobagoTurkeyUgandaUkraineUruguayUzbekistanVenezuelaVietnamWest IndiesWestern AfricaWestern AsiaWestern EuropeYemenZaireZimbabweAzores
6th Grade
Income
Poverty
Unemployment
Labor Participation
Family Structure
Vehicle Availability
Education Level
Disability

6th Grade Comparison

Zimbabweans

Chippewa

Exceptional
Exceptional
97.6%
6TH GRADE
99.1/ 100
METRIC RATING
82nd/ 347
METRIC RANK
97.9%
6TH GRADE
100.0/ 100
METRIC RATING
33rd/ 347
METRIC RANK

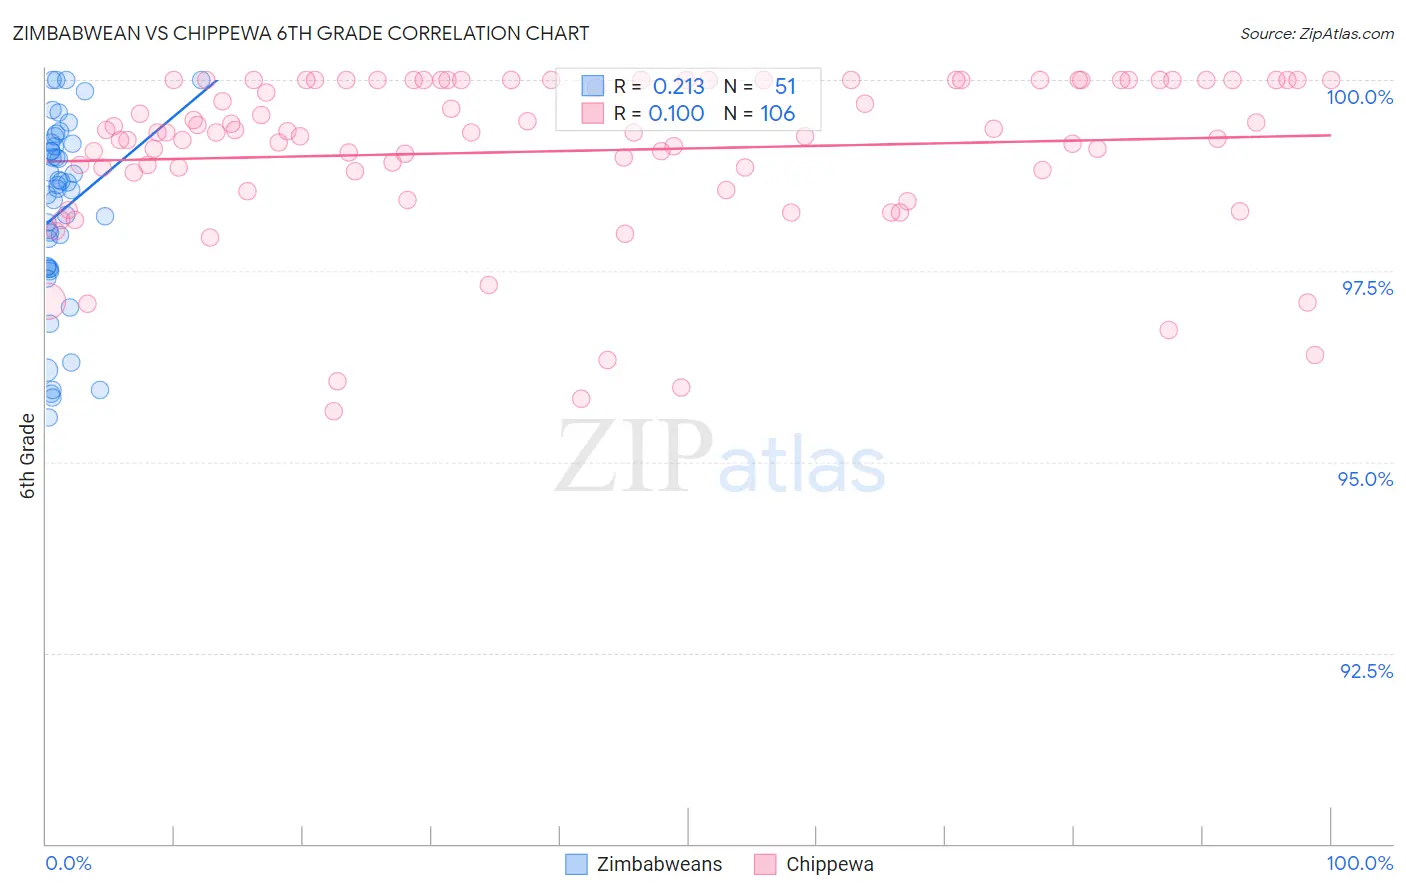
Zimbabwean vs Chippewa 6th Grade Correlation Chart

The statistical analysis conducted on geographies consisting of 69,203,423 people shows a weak positive correlation between the proportion of Zimbabweans and percentage of population with at least 6th grade education in the United States with a correlation coefficient (R) of 0.213 and weighted average of 97.6%. Similarly, the statistical analysis conducted on geographies consisting of 215,065,644 people shows a slight positive correlation between the proportion of Chippewa and percentage of population with at least 6th grade education in the United States with a correlation coefficient (R) of 0.100 and weighted average of 97.9%, a difference of 0.38%.
Zimbabwean vs Chippewa 6th Grade

6th Grade Correlation Summary

MeasurementZimbabweanChippewa
Minimum95.6%95.7%
Maximum100.0%100.0%
Range4.4%4.3%
Mean98.3%99.1%
Median98.6%99.3%
Interquartile 25% (IQ1)97.5%98.8%
Interquartile 75% (IQ3)99.2%100.0%
Interquartile Range (IQR)1.6%1.2%
Standard Deviation (Sample)1.2%1.1%
Standard Deviation (Population)1.2%1.1%

Similar Demographics by 6th Grade

Demographics Similar to Zimbabweans by 6th Grade

In terms of 6th grade, the demographic groups most similar to Zimbabweans are Lumbee (97.6%, a difference of 0.0%), Potawatomi (97.6%, a difference of 0.010%), Shoshone (97.6%, a difference of 0.010%), Immigrants from Lithuania (97.6%, a difference of 0.020%), and Icelander (97.6%, a difference of 0.020%).
DemographicsRating | Rank6th Grade
Ukrainians
99.4
/100
|
#75
Exceptional
97.6%
Immigrants | England
99.4
/100
|
#76
Exceptional
97.6%
Immigrants | Lithuania
99.3
/100
|
#77
Exceptional
97.6%
Icelanders
99.3
/100
|
#78
Exceptional
97.6%
Immigrants | India
99.3
/100
|
#79
Exceptional
97.6%
Osage
99.3
/100
|
#80
Exceptional
97.6%
Lumbee
99.2
/100
|
#81
Exceptional
97.6%
Zimbabweans
99.1
/100
|
#82
Exceptional
97.6%
Potawatomi
99.1
/100
|
#83
Exceptional
97.6%
Shoshone
99.0
/100
|
#84
Exceptional
97.6%
Delaware
98.9
/100
|
#85
Exceptional
97.6%
Immigrants | Belgium
98.9
/100
|
#86
Exceptional
97.5%
Puget Sound Salish
98.9
/100
|
#87
Exceptional
97.5%
Immigrants | South Africa
98.9
/100
|
#88
Exceptional
97.5%
Immigrants | Australia
98.8
/100
|
#89
Exceptional
97.5%

Demographics Similar to Chippewa by 6th Grade

In terms of 6th grade, the demographic groups most similar to Chippewa are Swiss (97.9%, a difference of 0.0%), Chinese (97.9%, a difference of 0.030%), Italian (97.9%, a difference of 0.030%), European (98.0%, a difference of 0.040%), and Alaska Native (98.0%, a difference of 0.040%).
DemographicsRating | Rank6th Grade
Czechs
100.0
/100
|
#26
Exceptional
98.0%
Yup'ik
100.0
/100
|
#27
Exceptional
98.0%
Scandinavians
100.0
/100
|
#28
Exceptional
98.0%
French
100.0
/100
|
#29
Exceptional
98.0%
French Canadians
100.0
/100
|
#30
Exceptional
98.0%
Europeans
100.0
/100
|
#31
Exceptional
98.0%
Alaska Natives
100.0
/100
|
#32
Exceptional
98.0%
Chippewa
100.0
/100
|
#33
Exceptional
97.9%
Swiss
100.0
/100
|
#34
Exceptional
97.9%
Chinese
100.0
/100
|
#35
Exceptional
97.9%
Italians
100.0
/100
|
#36
Exceptional
97.9%
British
100.0
/100
|
#37
Exceptional
97.9%
Belgians
100.0
/100
|
#38
Exceptional
97.9%
Luxembourgers
99.9
/100
|
#39
Exceptional
97.9%
Latvians
99.9
/100
|
#40
Exceptional
97.9%