Immigrants from Sierra Leone vs Chippewa Births to Unmarried Women
COMPARE
Immigrants from Sierra Leone
Chippewa
Births to Unmarried Women
Births to Unmarried Women Comparison
Immigrants from Sierra Leone
Chippewa
34.2%
BIRTHS TO UNMARRIED WOMEN
3.1/ 100
METRIC RATING
229th/ 347
METRIC RANK
42.6%
BIRTHS TO UNMARRIED WOMEN
0.0/ 100
METRIC RATING
330th/ 347
METRIC RANK
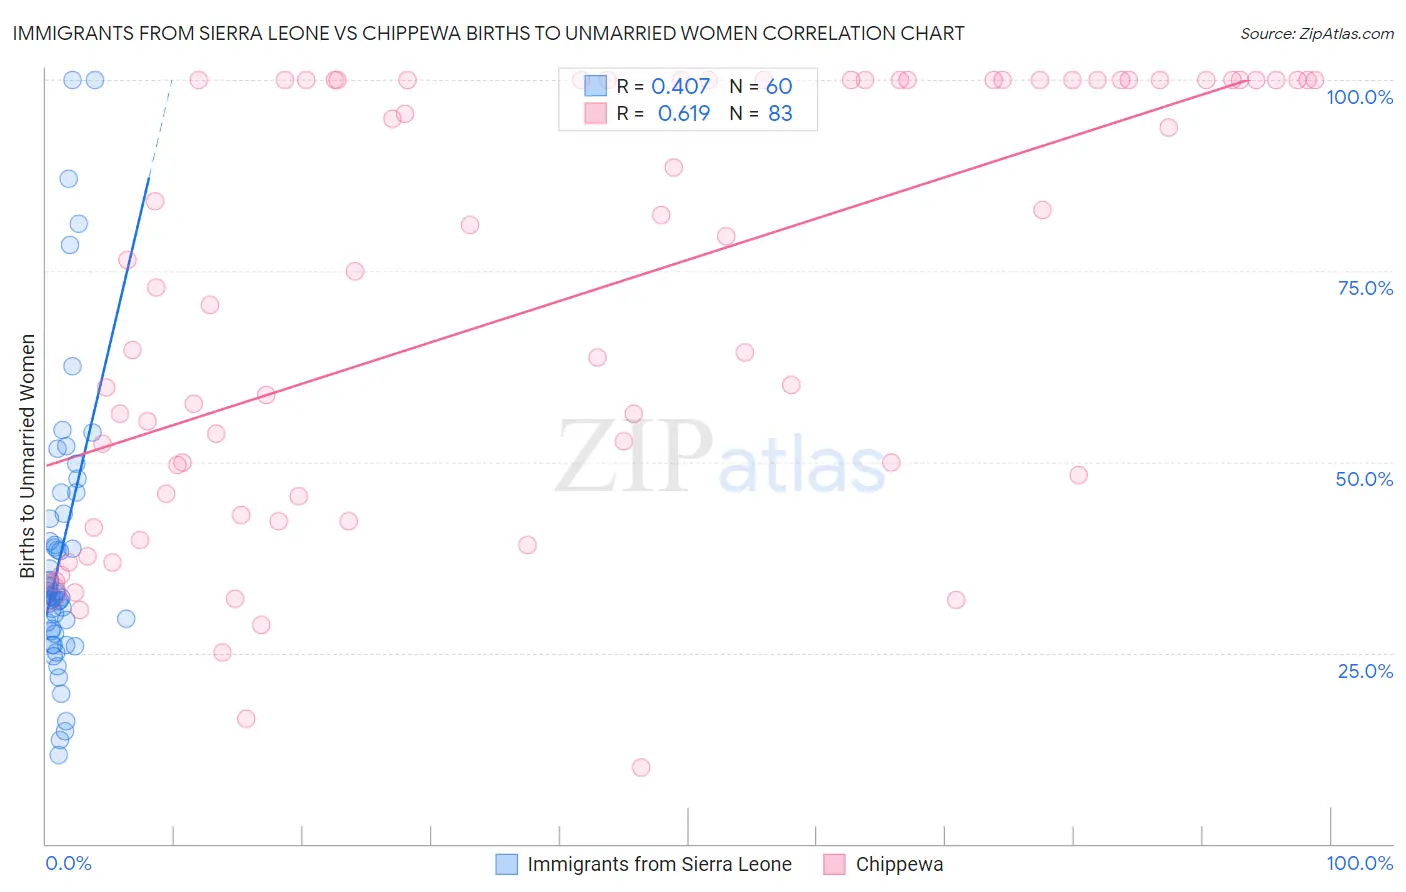
Immigrants from Sierra Leone vs Chippewa Births to Unmarried Women Correlation Chart
The statistical analysis conducted on geographies consisting of 99,540,756 people shows a moderate positive correlation between the proportion of Immigrants from Sierra Leone and percentage of births to unmarried women in the United States with a correlation coefficient (R) of 0.407 and weighted average of 34.2%. Similarly, the statistical analysis conducted on geographies consisting of 205,326,129 people shows a significant positive correlation between the proportion of Chippewa and percentage of births to unmarried women in the United States with a correlation coefficient (R) of 0.619 and weighted average of 42.6%, a difference of 24.5%.
Births to Unmarried Women Correlation Summary
| Measurement | Immigrants from Sierra Leone | Chippewa |
| Minimum | 11.7% | 10.0% |
| Maximum | 100.0% | 100.0% |
| Range | 88.3% | 90.0% |
| Mean | 38.2% | 71.0% |
| Median | 32.6% | 75.0% |
| Interquartile 25% (IQ1) | 28.0% | 45.5% |
| Interquartile 75% (IQ3) | 42.9% | 100.0% |
| Interquartile Range (IQR) | 14.9% | 54.5% |
| Standard Deviation (Sample) | 18.7% | 27.9% |
| Standard Deviation (Population) | 18.6% | 27.7% |
Similar Demographics by Births to Unmarried Women
Demographics Similar to Immigrants from Sierra Leone by Births to Unmarried Women
In terms of births to unmarried women, the demographic groups most similar to Immigrants from Sierra Leone are Ghanaian (34.3%, a difference of 0.020%), Panamanian (34.2%, a difference of 0.11%), Immigrants from Panama (34.2%, a difference of 0.14%), Delaware (34.2%, a difference of 0.16%), and Native Hawaiian (34.3%, a difference of 0.17%).
| Demographics | Rating | Rank | Births to Unmarried Women |
| Immigrants | Uruguay | 4.8 /100 | #222 | Tragic 33.9% |
| Pennsylvania Germans | 4.3 /100 | #223 | Tragic 34.0% |
| Immigrants | Laos | 4.3 /100 | #224 | Tragic 34.0% |
| Spanish | 4.0 /100 | #225 | Tragic 34.1% |
| Delaware | 3.3 /100 | #226 | Tragic 34.2% |
| Immigrants | Panama | 3.3 /100 | #227 | Tragic 34.2% |
| Panamanians | 3.3 /100 | #228 | Tragic 34.2% |
| Immigrants | Sierra Leone | 3.1 /100 | #229 | Tragic 34.2% |
| Ghanaians | 3.1 /100 | #230 | Tragic 34.3% |
| Native Hawaiians | 2.9 /100 | #231 | Tragic 34.3% |
| French Canadians | 2.5 /100 | #232 | Tragic 34.4% |
| Bangladeshis | 2.5 /100 | #233 | Tragic 34.4% |
| Immigrants | Zaire | 2.3 /100 | #234 | Tragic 34.5% |
| Immigrants | Ghana | 2.2 /100 | #235 | Tragic 34.5% |
| Immigrants | Cameroon | 1.6 /100 | #236 | Tragic 34.7% |
Demographics Similar to Chippewa by Births to Unmarried Women
In terms of births to unmarried women, the demographic groups most similar to Chippewa are Paiute (42.5%, a difference of 0.40%), Native/Alaskan (43.0%, a difference of 0.83%), Immigrants from Cabo Verde (42.2%, a difference of 1.0%), Tsimshian (42.2%, a difference of 1.1%), and Kiowa (43.1%, a difference of 1.2%).
| Demographics | Rating | Rank | Births to Unmarried Women |
| Sioux | 0.0 /100 | #323 | Tragic 41.0% |
| Cape Verdeans | 0.0 /100 | #324 | Tragic 41.3% |
| Cheyenne | 0.0 /100 | #325 | Tragic 41.3% |
| Immigrants | Cuba | 0.0 /100 | #326 | Tragic 41.5% |
| Tsimshian | 0.0 /100 | #327 | Tragic 42.2% |
| Immigrants | Cabo Verde | 0.0 /100 | #328 | Tragic 42.2% |
| Paiute | 0.0 /100 | #329 | Tragic 42.5% |
| Chippewa | 0.0 /100 | #330 | Tragic 42.6% |
| Natives/Alaskans | 0.0 /100 | #331 | Tragic 43.0% |
| Kiowa | 0.0 /100 | #332 | Tragic 43.1% |
| Blacks/African Americans | 0.0 /100 | #333 | Tragic 44.3% |
| Yuman | 0.0 /100 | #334 | Tragic 44.4% |
| Colville | 0.0 /100 | #335 | Tragic 45.3% |
| Puerto Ricans | 0.0 /100 | #336 | Tragic 45.7% |
| Houma | 0.0 /100 | #337 | Tragic 46.6% |