Immigrants from Sierra Leone vs Immigrants from Bahamas Births to Unmarried Women
COMPARE
Immigrants from Sierra Leone
Immigrants from Bahamas
Births to Unmarried Women
Births to Unmarried Women Comparison
Immigrants from Sierra Leone
Immigrants from Bahamas
34.2%
BIRTHS TO UNMARRIED WOMEN
3.1/ 100
METRIC RATING
229th/ 347
METRIC RANK
40.1%
BIRTHS TO UNMARRIED WOMEN
0.0/ 100
METRIC RATING
318th/ 347
METRIC RANK
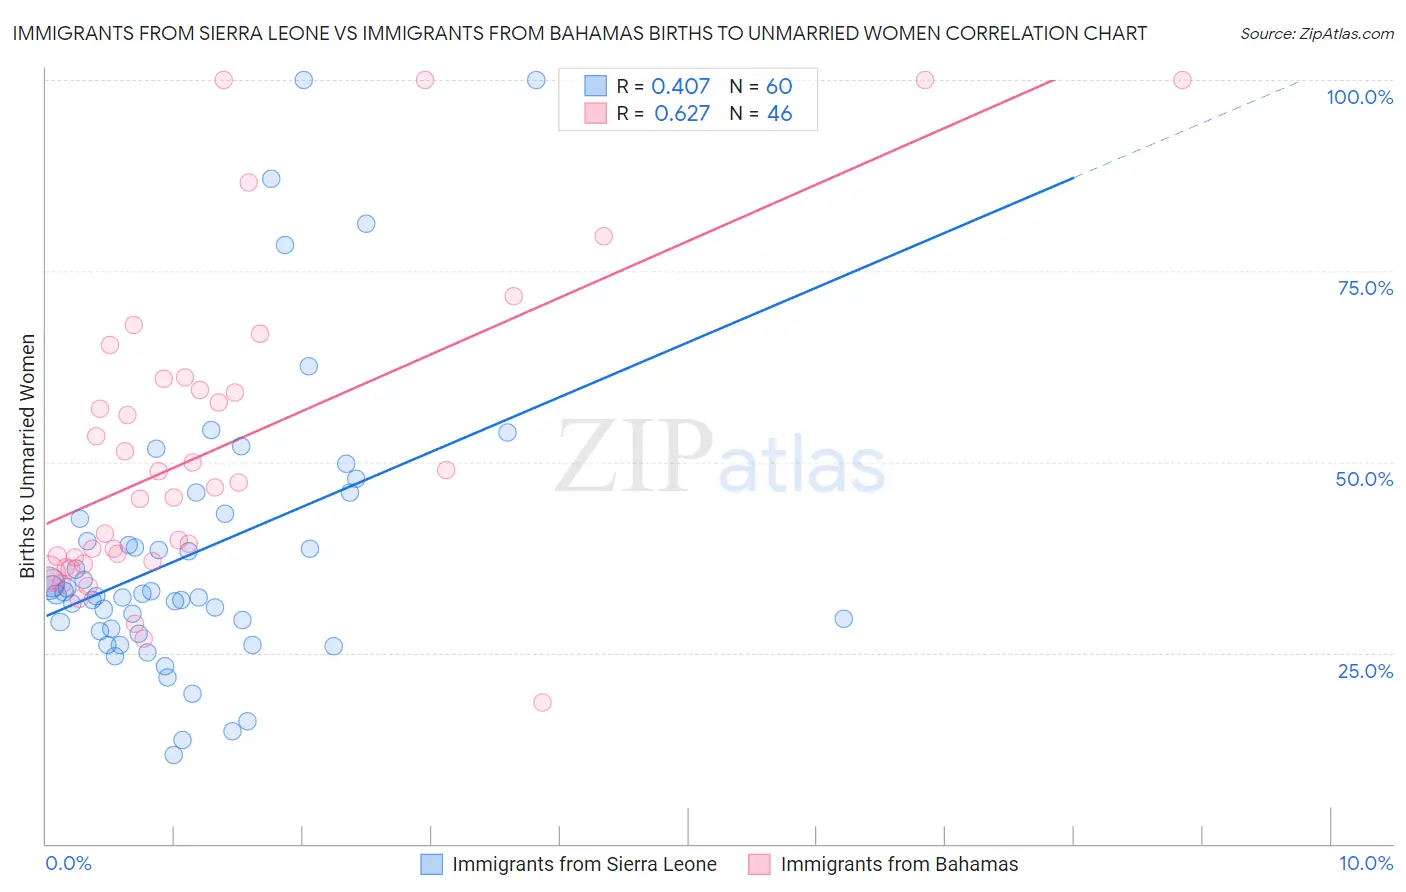
Immigrants from Sierra Leone vs Immigrants from Bahamas Births to Unmarried Women Correlation Chart
The statistical analysis conducted on geographies consisting of 99,540,756 people shows a moderate positive correlation between the proportion of Immigrants from Sierra Leone and percentage of births to unmarried women in the United States with a correlation coefficient (R) of 0.407 and weighted average of 34.2%. Similarly, the statistical analysis conducted on geographies consisting of 103,055,032 people shows a significant positive correlation between the proportion of Immigrants from Bahamas and percentage of births to unmarried women in the United States with a correlation coefficient (R) of 0.627 and weighted average of 40.1%, a difference of 17.1%.
Births to Unmarried Women Correlation Summary
| Measurement | Immigrants from Sierra Leone | Immigrants from Bahamas |
| Minimum | 11.7% | 18.5% |
| Maximum | 100.0% | 100.0% |
| Range | 88.3% | 81.5% |
| Mean | 38.2% | 51.9% |
| Median | 32.6% | 47.0% |
| Interquartile 25% (IQ1) | 28.0% | 37.0% |
| Interquartile 75% (IQ3) | 42.9% | 60.9% |
| Interquartile Range (IQR) | 14.9% | 23.9% |
| Standard Deviation (Sample) | 18.7% | 20.6% |
| Standard Deviation (Population) | 18.6% | 20.3% |
Similar Demographics by Births to Unmarried Women
Demographics Similar to Immigrants from Sierra Leone by Births to Unmarried Women
In terms of births to unmarried women, the demographic groups most similar to Immigrants from Sierra Leone are Ghanaian (34.3%, a difference of 0.020%), Panamanian (34.2%, a difference of 0.11%), Immigrants from Panama (34.2%, a difference of 0.14%), Delaware (34.2%, a difference of 0.16%), and Native Hawaiian (34.3%, a difference of 0.17%).
| Demographics | Rating | Rank | Births to Unmarried Women |
| Immigrants | Uruguay | 4.8 /100 | #222 | Tragic 33.9% |
| Pennsylvania Germans | 4.3 /100 | #223 | Tragic 34.0% |
| Immigrants | Laos | 4.3 /100 | #224 | Tragic 34.0% |
| Spanish | 4.0 /100 | #225 | Tragic 34.1% |
| Delaware | 3.3 /100 | #226 | Tragic 34.2% |
| Immigrants | Panama | 3.3 /100 | #227 | Tragic 34.2% |
| Panamanians | 3.3 /100 | #228 | Tragic 34.2% |
| Immigrants | Sierra Leone | 3.1 /100 | #229 | Tragic 34.2% |
| Ghanaians | 3.1 /100 | #230 | Tragic 34.3% |
| Native Hawaiians | 2.9 /100 | #231 | Tragic 34.3% |
| French Canadians | 2.5 /100 | #232 | Tragic 34.4% |
| Bangladeshis | 2.5 /100 | #233 | Tragic 34.4% |
| Immigrants | Zaire | 2.3 /100 | #234 | Tragic 34.5% |
| Immigrants | Ghana | 2.2 /100 | #235 | Tragic 34.5% |
| Immigrants | Cameroon | 1.6 /100 | #236 | Tragic 34.7% |
Demographics Similar to Immigrants from Bahamas by Births to Unmarried Women
In terms of births to unmarried women, the demographic groups most similar to Immigrants from Bahamas are Immigrants from Dominican Republic (40.1%, a difference of 0.070%), Yakama (40.3%, a difference of 0.56%), Crow (40.4%, a difference of 0.61%), Apache (39.9%, a difference of 0.62%), and Dominican (39.8%, a difference of 0.68%).
| Demographics | Rating | Rank | Births to Unmarried Women |
| Immigrants | Azores | 0.0 /100 | #311 | Tragic 39.6% |
| U.S. Virgin Islanders | 0.0 /100 | #312 | Tragic 39.6% |
| Africans | 0.0 /100 | #313 | Tragic 39.7% |
| Immigrants | Caribbean | 0.0 /100 | #314 | Tragic 39.8% |
| Dominicans | 0.0 /100 | #315 | Tragic 39.8% |
| Apache | 0.0 /100 | #316 | Tragic 39.9% |
| Immigrants | Dominican Republic | 0.0 /100 | #317 | Tragic 40.1% |
| Immigrants | Bahamas | 0.0 /100 | #318 | Tragic 40.1% |
| Yakama | 0.0 /100 | #319 | Tragic 40.3% |
| Crow | 0.0 /100 | #320 | Tragic 40.4% |
| Bahamians | 0.0 /100 | #321 | Tragic 40.8% |
| Cajuns | 0.0 /100 | #322 | Tragic 41.0% |
| Sioux | 0.0 /100 | #323 | Tragic 41.0% |
| Cape Verdeans | 0.0 /100 | #324 | Tragic 41.3% |
| Cheyenne | 0.0 /100 | #325 | Tragic 41.3% |