Welsh vs Finnish College, Under 1 year

COMPARE

Welsh
Race
Ancestry
AfghanAfricanAlaska NativeAlaskan AthabascanAlbanianAleutAlsatianAmericanApacheArabArapahoArgentineanArmenianAssyrian/Chaldean/SyriacAustralianAustrianBahamianBangladeshiBarbadianBasqueBelgianBelizeanBermudanBhutaneseBlackfeetBolivianBrazilianBritishBritish West IndianBulgarianBurmeseCajunCambodianCanadianCape VerdeanCarpatho RusynCelticCentral AmericanCentral American IndianCherokeeCheyenneChickasawChileanChineseChippewaChoctawColombianColvilleComancheCosta RicanCreeCreekCroatianCrowCubanCypriotCzechCzechoslovakianDanishDelawareDominicanDutchDutch West IndianEastern EuropeanEcuadorianEgyptianEnglishEstonianEthiopianEuropeanFijianFilipinoFrenchFrench American IndianFrench CanadianGermanGerman RussianGhanaianGreekGuamanian/ChamorroGuatemalanGuyaneseHaitianHmongHonduranHopiHoumaHungarianIcelanderIndian (Asian)IndonesianInupiatIranianIraqiIrishIroquoisIsraeliItalianJamaicanJapaneseJordanianKenyanKiowaKoreanLaotianLatvianLebaneseLiberianLithuanianLumbeeLuxembourgerMacedonianMalaysianMalteseMarshalleseMenomineeMexicanMexican American IndianMongolianMoroccanNative HawaiianNavajoNepaleseNew ZealanderNicaraguanNigerianNorthern EuropeanNorwegianOkinawanOsageOttawaPaiutePakistaniPalestinianPanamanianParaguayanPennsylvania GermanPeruvianPimaPolishPortuguesePotawatomiPuebloPuerto RicanPuget Sound SalishRomanianRussianSalvadoranSamoanScandinavianScotch-IrishScottishSeminoleSenegaleseSerbianShoshoneSierra LeoneanSiouxSlavicSlovakSloveneSomaliSouth AfricanSouth AmericanSouth American IndianSoviet UnionSpaniardSpanishSpanish AmericanSpanish American IndianSri LankanSubsaharan AfricanSudaneseSwedishSwissSyrianTaiwaneseThaiTlingit-HaidaTohono O'OdhamTonganTrinidadian and TobagonianTsimshianTurkishU.S. Virgin IslanderUgandanUkrainianUruguayanUteVenezuelanVietnameseWelshWest IndianYakamaYaquiYugoslavianYumanYup'ikZimbabwean
Immigration
NonimmigrantsImmigrantsAfghanistanAfricaAlbaniaArgentinaArmeniaAsiaAustraliaAustriaBahamasBangladeshBarbadosBelarusBelgiumBelizeBoliviaBosnia and HerzegovinaBrazilBulgariaBurma/MyanmarCabo VerdeCambodiaCameroonCanadaCaribbeanCentral AmericaChileChinaColombiaCongoCosta RicaCroatiaCubaCzechoslovakiaDenmarkDominicaDominican RepublicEastern AfricaEastern AsiaEastern EuropeEcuadorEgyptEl SalvadorEnglandEritreaEthiopiaEuropeFijiFranceGermanyGhanaGreeceGrenadaGuatemalaGuyanaHaitiHondurasHong KongHungaryIndiaIndonesiaIranIraqIrelandIsraelItalyJamaicaJapanJordanKazakhstanKenyaKoreaKuwaitLaosLatin AmericaLatviaLebanonLiberiaLithuaniaMalaysiaMexicoMicronesiaMiddle AfricaMoldovaMoroccoNepalNetherlandsNicaraguaNigeriaNorth AmericaNorth MacedoniaNorthern AfricaNorthern EuropeNorwayOceaniaPakistanPanamaPeruPhilippinesPolandPortugalRomaniaRussiaSaudi ArabiaScotlandSenegalSerbiaSierra LeoneSingaporeSomaliaSouth AfricaSouth AmericaSouth Central AsiaSouth Eastern AsiaSouthern EuropeSpainSri LankaSt. Vincent and the GrenadinesSudanSwedenSwitzerlandSyriaTaiwanThailandTrinidad and TobagoTurkeyUgandaUkraineUruguayUzbekistanVenezuelaVietnamWest IndiesWestern AfricaWestern AsiaWestern EuropeYemenZaireZimbabweAzores
Finnish
Race
Ancestry
AfghanAfricanAlaska NativeAlaskan AthabascanAlbanianAleutAlsatianAmericanApacheArabArapahoArgentineanArmenianAssyrian/Chaldean/SyriacAustralianAustrianBahamianBangladeshiBarbadianBasqueBelgianBelizeanBermudanBhutaneseBlackfeetBolivianBrazilianBritishBritish West IndianBulgarianBurmeseCajunCambodianCanadianCape VerdeanCarpatho RusynCelticCentral AmericanCentral American IndianCherokeeCheyenneChickasawChileanChineseChippewaChoctawColombianColvilleComancheCosta RicanCreeCreekCroatianCrowCubanCypriotCzechCzechoslovakianDanishDelawareDominicanDutchDutch West IndianEastern EuropeanEcuadorianEgyptianEnglishEstonianEthiopianEuropeanFijianFilipinoFinnishFrenchFrench American IndianFrench CanadianGermanGerman RussianGhanaianGreekGuamanian/ChamorroGuatemalanGuyaneseHaitianHmongHonduranHopiHoumaHungarianIcelanderIndian (Asian)IndonesianInupiatIranianIraqiIrishIroquoisIsraeliItalianJamaicanJapaneseJordanianKenyanKiowaKoreanLaotianLatvianLebaneseLiberianLithuanianLumbeeLuxembourgerMacedonianMalaysianMalteseMarshalleseMenomineeMexicanMexican American IndianMongolianMoroccanNative HawaiianNavajoNepaleseNew ZealanderNicaraguanNigerianNorthern EuropeanNorwegianOkinawanOsageOttawaPaiutePakistaniPalestinianPanamanianParaguayanPennsylvania GermanPeruvianPimaPolishPortuguesePotawatomiPuebloPuerto RicanPuget Sound SalishRomanianRussianSalvadoranSamoanScandinavianScotch-IrishScottishSeminoleSenegaleseSerbianShoshoneSierra LeoneanSiouxSlavicSlovakSloveneSomaliSouth AfricanSouth AmericanSouth American IndianSoviet UnionSpaniardSpanishSpanish AmericanSpanish American IndianSri LankanSubsaharan AfricanSudaneseSwedishSwissSyrianTaiwaneseThaiTlingit-HaidaTohono O'OdhamTonganTrinidadian and TobagonianTsimshianTurkishU.S. Virgin IslanderUgandanUkrainianUruguayanUteVenezuelanVietnameseWest IndianYakamaYaquiYugoslavianYumanYup'ikZimbabwean
Immigration
NonimmigrantsImmigrantsAfghanistanAfricaAlbaniaArgentinaArmeniaAsiaAustraliaAustriaBahamasBangladeshBarbadosBelarusBelgiumBelizeBoliviaBosnia and HerzegovinaBrazilBulgariaBurma/MyanmarCabo VerdeCambodiaCameroonCanadaCaribbeanCentral AmericaChileChinaColombiaCongoCosta RicaCroatiaCubaCzechoslovakiaDenmarkDominicaDominican RepublicEastern AfricaEastern AsiaEastern EuropeEcuadorEgyptEl SalvadorEnglandEritreaEthiopiaEuropeFijiFranceGermanyGhanaGreeceGrenadaGuatemalaGuyanaHaitiHondurasHong KongHungaryIndiaIndonesiaIranIraqIrelandIsraelItalyJamaicaJapanJordanKazakhstanKenyaKoreaKuwaitLaosLatin AmericaLatviaLebanonLiberiaLithuaniaMalaysiaMexicoMicronesiaMiddle AfricaMoldovaMoroccoNepalNetherlandsNicaraguaNigeriaNorth AmericaNorth MacedoniaNorthern AfricaNorthern EuropeNorwayOceaniaPakistanPanamaPeruPhilippinesPolandPortugalRomaniaRussiaSaudi ArabiaScotlandSenegalSerbiaSierra LeoneSingaporeSomaliaSouth AfricaSouth AmericaSouth Central AsiaSouth Eastern AsiaSouthern EuropeSpainSri LankaSt. Vincent and the GrenadinesSudanSwedenSwitzerlandSyriaTaiwanThailandTrinidad and TobagoTurkeyUgandaUkraineUruguayUzbekistanVenezuelaVietnamWest IndiesWestern AfricaWestern AsiaWestern EuropeYemenZaireZimbabweAzores
College, Under 1 year
Income
Poverty
Unemployment
Labor Participation
Family Structure
Vehicle Availability
Education Level
Disability

College, Under 1 year Comparison

Welsh

Finns

Good
Excellent
66.0%
COLLEGE, UNDER 1 YEAR
69.9/ 100
METRIC RATING
156th/ 347
METRIC RANK
66.9%
COLLEGE, UNDER 1 YEAR
88.6/ 100
METRIC RATING
131st/ 347
METRIC RANK

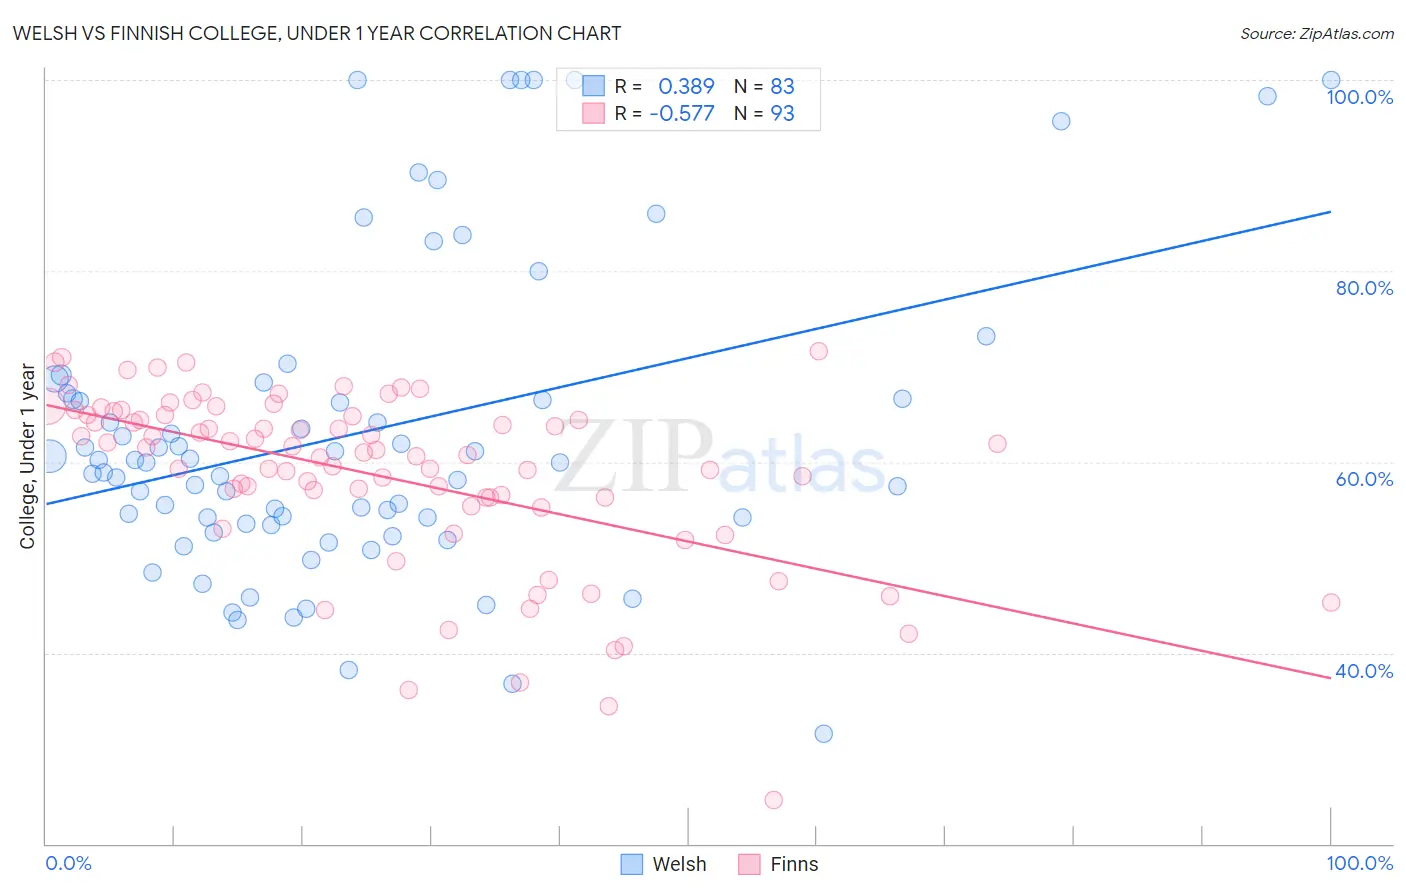
Welsh vs Finnish College, Under 1 year Correlation Chart

The statistical analysis conducted on geographies consisting of 528,593,935 people shows a mild positive correlation between the proportion of Welsh and percentage of population with at least college, under 1 year education in the United States with a correlation coefficient (R) of 0.389 and weighted average of 66.0%. Similarly, the statistical analysis conducted on geographies consisting of 404,673,530 people shows a substantial negative correlation between the proportion of Finns and percentage of population with at least college, under 1 year education in the United States with a correlation coefficient (R) of -0.577 and weighted average of 66.9%, a difference of 1.3%.
Welsh vs Finnish College, Under 1 year

College, Under 1 year Correlation Summary

MeasurementWelshFinnish
Minimum31.6%24.5%
Maximum100.0%71.6%
Range68.4%47.0%
Mean63.1%58.5%
Median60.0%60.9%
Interquartile 25% (IQ1)53.5%55.8%
Interquartile 75% (IQ3)67.2%64.9%
Interquartile Range (IQR)13.7%9.1%
Standard Deviation (Sample)16.3%9.3%
Standard Deviation (Population)16.2%9.2%

Similar Demographics by College, Under 1 year

Demographics Similar to Welsh by College, Under 1 year

In terms of college, under 1 year, the demographic groups most similar to Welsh are Irish (66.0%, a difference of 0.020%), Sierra Leonean (66.0%, a difference of 0.10%), Immigrants from Eritrea (66.1%, a difference of 0.11%), Celtic (65.9%, a difference of 0.13%), and Tlingit-Haida (65.9%, a difference of 0.18%).
DemographicsRating | RankCollege, Under 1 year
Immigrants | Venezuela
77.9
/100
|
#149
Good
66.3%
Immigrants | Iraq
77.1
/100
|
#150
Good
66.3%
Immigrants | Sudan
76.0
/100
|
#151
Good
66.2%
Sudanese
74.1
/100
|
#152
Good
66.2%
Belgians
73.7
/100
|
#153
Good
66.2%
Immigrants | Eritrea
71.9
/100
|
#154
Good
66.1%
Irish
70.3
/100
|
#155
Good
66.0%
Welsh
69.9
/100
|
#156
Good
66.0%
Sierra Leoneans
67.8
/100
|
#157
Good
66.0%
Celtics
67.3
/100
|
#158
Good
65.9%
Tlingit-Haida
66.4
/100
|
#159
Good
65.9%
Albanians
66.1
/100
|
#160
Good
65.9%
Brazilians
66.0
/100
|
#161
Good
65.9%
Koreans
65.3
/100
|
#162
Good
65.9%
Somalis
62.7
/100
|
#163
Good
65.8%

Demographics Similar to Finns by College, Under 1 year

In terms of college, under 1 year, the demographic groups most similar to Finns are Polish (66.9%, a difference of 0.020%), Immigrants from Brazil (66.9%, a difference of 0.030%), Immigrants from Syria (66.9%, a difference of 0.040%), Iraqi (66.8%, a difference of 0.060%), and Canadian (66.8%, a difference of 0.070%).
DemographicsRating | RankCollege, Under 1 year
Arabs
92.6
/100
|
#124
Exceptional
67.2%
Italians
91.8
/100
|
#125
Exceptional
67.2%
Alsatians
91.3
/100
|
#126
Exceptional
67.1%
Czechs
90.8
/100
|
#127
Exceptional
67.1%
Scottish
90.2
/100
|
#128
Exceptional
67.0%
Immigrants | Eastern Africa
89.5
/100
|
#129
Excellent
67.0%
Immigrants | Syria
89.0
/100
|
#130
Excellent
66.9%
Finns
88.6
/100
|
#131
Excellent
66.9%
Poles
88.4
/100
|
#132
Excellent
66.9%
Immigrants | Brazil
88.3
/100
|
#133
Excellent
66.9%
Iraqis
88.0
/100
|
#134
Excellent
66.8%
Canadians
87.9
/100
|
#135
Excellent
66.8%
Ugandans
87.8
/100
|
#136
Excellent
66.8%
Immigrants | Chile
87.4
/100
|
#137
Excellent
66.8%
Immigrants | Italy
86.9
/100
|
#138
Excellent
66.8%