Moroccan vs Romanian College, Under 1 year

COMPARE

Moroccan
Race
Ancestry
AfghanAfricanAlaska NativeAlaskan AthabascanAlbanianAleutAlsatianAmericanApacheArabArapahoArgentineanArmenianAssyrian/Chaldean/SyriacAustralianAustrianBahamianBangladeshiBarbadianBasqueBelgianBelizeanBermudanBhutaneseBlackfeetBolivianBrazilianBritishBritish West IndianBulgarianBurmeseCajunCambodianCanadianCape VerdeanCarpatho RusynCelticCentral AmericanCentral American IndianCherokeeCheyenneChickasawChileanChineseChippewaChoctawColombianColvilleComancheCosta RicanCreeCreekCroatianCrowCubanCypriotCzechCzechoslovakianDanishDelawareDominicanDutchDutch West IndianEastern EuropeanEcuadorianEgyptianEnglishEstonianEthiopianEuropeanFijianFilipinoFinnishFrenchFrench American IndianFrench CanadianGermanGerman RussianGhanaianGreekGuamanian/ChamorroGuatemalanGuyaneseHaitianHmongHonduranHopiHoumaHungarianIcelanderIndian (Asian)IndonesianInupiatIranianIraqiIrishIroquoisIsraeliItalianJamaicanJapaneseJordanianKenyanKiowaKoreanLaotianLatvianLebaneseLiberianLithuanianLumbeeLuxembourgerMacedonianMalaysianMalteseMarshalleseMenomineeMexicanMexican American IndianMongolianMoroccanNative HawaiianNavajoNepaleseNew ZealanderNicaraguanNigerianNorthern EuropeanNorwegianOkinawanOsageOttawaPaiutePakistaniPalestinianPanamanianParaguayanPennsylvania GermanPeruvianPimaPolishPortuguesePotawatomiPuebloPuerto RicanPuget Sound SalishRussianSalvadoranSamoanScandinavianScotch-IrishScottishSeminoleSenegaleseSerbianShoshoneSierra LeoneanSiouxSlavicSlovakSloveneSomaliSouth AfricanSouth AmericanSouth American IndianSoviet UnionSpaniardSpanishSpanish AmericanSpanish American IndianSri LankanSubsaharan AfricanSudaneseSwedishSwissSyrianTaiwaneseThaiTlingit-HaidaTohono O'OdhamTonganTrinidadian and TobagonianTsimshianTurkishU.S. Virgin IslanderUgandanUkrainianUruguayanUteVenezuelanVietnameseWelshWest IndianYakamaYaquiYugoslavianYumanYup'ikZimbabwean
Immigration
NonimmigrantsImmigrantsAfghanistanAfricaAlbaniaArgentinaArmeniaAsiaAustraliaAustriaBahamasBangladeshBarbadosBelarusBelgiumBelizeBoliviaBosnia and HerzegovinaBrazilBulgariaBurma/MyanmarCabo VerdeCambodiaCameroonCanadaCaribbeanCentral AmericaChileChinaColombiaCongoCosta RicaCroatiaCubaCzechoslovakiaDenmarkDominicaDominican RepublicEastern AfricaEastern AsiaEastern EuropeEcuadorEgyptEl SalvadorEnglandEritreaEthiopiaEuropeFijiFranceGermanyGhanaGreeceGrenadaGuatemalaGuyanaHaitiHondurasHong KongHungaryIndiaIndonesiaIranIraqIrelandIsraelItalyJamaicaJapanJordanKazakhstanKenyaKoreaKuwaitLaosLatin AmericaLatviaLebanonLiberiaLithuaniaMalaysiaMexicoMicronesiaMiddle AfricaMoldovaMoroccoNepalNetherlandsNicaraguaNigeriaNorth AmericaNorth MacedoniaNorthern AfricaNorthern EuropeNorwayOceaniaPakistanPanamaPeruPhilippinesPolandPortugalRomaniaRussiaSaudi ArabiaScotlandSenegalSerbiaSierra LeoneSingaporeSomaliaSouth AfricaSouth AmericaSouth Central AsiaSouth Eastern AsiaSouthern EuropeSpainSri LankaSt. Vincent and the GrenadinesSudanSwedenSwitzerlandSyriaTaiwanThailandTrinidad and TobagoTurkeyUgandaUkraineUruguayUzbekistanVenezuelaVietnamWest IndiesWestern AfricaWestern AsiaWestern EuropeYemenZaireZimbabweAzores
Romanian
Race
Ancestry
AfghanAfricanAlaska NativeAlaskan AthabascanAlbanianAleutAlsatianAmericanApacheArabArapahoArgentineanArmenianAssyrian/Chaldean/SyriacAustralianAustrianBahamianBangladeshiBarbadianBasqueBelgianBelizeanBermudanBhutaneseBlackfeetBolivianBrazilianBritishBritish West IndianBulgarianBurmeseCajunCambodianCanadianCape VerdeanCarpatho RusynCelticCentral AmericanCentral American IndianCherokeeCheyenneChickasawChileanChineseChippewaChoctawColombianColvilleComancheCosta RicanCreeCreekCroatianCrowCubanCypriotCzechCzechoslovakianDanishDelawareDominicanDutchDutch West IndianEastern EuropeanEcuadorianEgyptianEnglishEstonianEthiopianEuropeanFijianFilipinoFinnishFrenchFrench American IndianFrench CanadianGermanGerman RussianGhanaianGreekGuamanian/ChamorroGuatemalanGuyaneseHaitianHmongHonduranHopiHoumaHungarianIcelanderIndian (Asian)IndonesianInupiatIranianIraqiIrishIroquoisIsraeliItalianJamaicanJapaneseJordanianKenyanKiowaKoreanLaotianLatvianLebaneseLiberianLithuanianLumbeeLuxembourgerMacedonianMalaysianMalteseMarshalleseMenomineeMexicanMexican American IndianMongolianNative HawaiianNavajoNepaleseNew ZealanderNicaraguanNigerianNorthern EuropeanNorwegianOkinawanOsageOttawaPaiutePakistaniPalestinianPanamanianParaguayanPennsylvania GermanPeruvianPimaPolishPortuguesePotawatomiPuebloPuerto RicanPuget Sound SalishRomanianRussianSalvadoranSamoanScandinavianScotch-IrishScottishSeminoleSenegaleseSerbianShoshoneSierra LeoneanSiouxSlavicSlovakSloveneSomaliSouth AfricanSouth AmericanSouth American IndianSoviet UnionSpaniardSpanishSpanish AmericanSpanish American IndianSri LankanSubsaharan AfricanSudaneseSwedishSwissSyrianTaiwaneseThaiTlingit-HaidaTohono O'OdhamTonganTrinidadian and TobagonianTsimshianTurkishU.S. Virgin IslanderUgandanUkrainianUruguayanUteVenezuelanVietnameseWelshWest IndianYakamaYaquiYugoslavianYumanYup'ikZimbabwean
Immigration
NonimmigrantsImmigrantsAfghanistanAfricaAlbaniaArgentinaArmeniaAsiaAustraliaAustriaBahamasBangladeshBarbadosBelarusBelgiumBelizeBoliviaBosnia and HerzegovinaBrazilBulgariaBurma/MyanmarCabo VerdeCambodiaCameroonCanadaCaribbeanCentral AmericaChileChinaColombiaCongoCosta RicaCroatiaCubaCzechoslovakiaDenmarkDominicaDominican RepublicEastern AfricaEastern AsiaEastern EuropeEcuadorEgyptEl SalvadorEnglandEritreaEthiopiaEuropeFijiFranceGermanyGhanaGreeceGrenadaGuatemalaGuyanaHaitiHondurasHong KongHungaryIndiaIndonesiaIranIraqIrelandIsraelItalyJamaicaJapanJordanKazakhstanKenyaKoreaKuwaitLaosLatin AmericaLatviaLebanonLiberiaLithuaniaMalaysiaMexicoMicronesiaMiddle AfricaMoldovaMoroccoNepalNetherlandsNicaraguaNigeriaNorth AmericaNorth MacedoniaNorthern AfricaNorthern EuropeNorwayOceaniaPakistanPanamaPeruPhilippinesPolandPortugalRomaniaRussiaSaudi ArabiaScotlandSenegalSerbiaSierra LeoneSingaporeSomaliaSouth AfricaSouth AmericaSouth Central AsiaSouth Eastern AsiaSouthern EuropeSpainSri LankaSt. Vincent and the GrenadinesSudanSwedenSwitzerlandSyriaTaiwanThailandTrinidad and TobagoTurkeyUgandaUkraineUruguayUzbekistanVenezuelaVietnamWest IndiesWestern AfricaWestern AsiaWestern EuropeYemenZaireZimbabweAzores
College, Under 1 year
Income
Poverty
Unemployment
Labor Participation
Family Structure
Vehicle Availability
Education Level
Disability

College, Under 1 year Comparison

Moroccans

Romanians

Average
Exceptional
65.6%
COLLEGE, UNDER 1 YEAR
56.7/ 100
METRIC RATING
166th/ 347
METRIC RANK
68.2%
COLLEGE, UNDER 1 YEAR
97.9/ 100
METRIC RATING
93rd/ 347
METRIC RANK

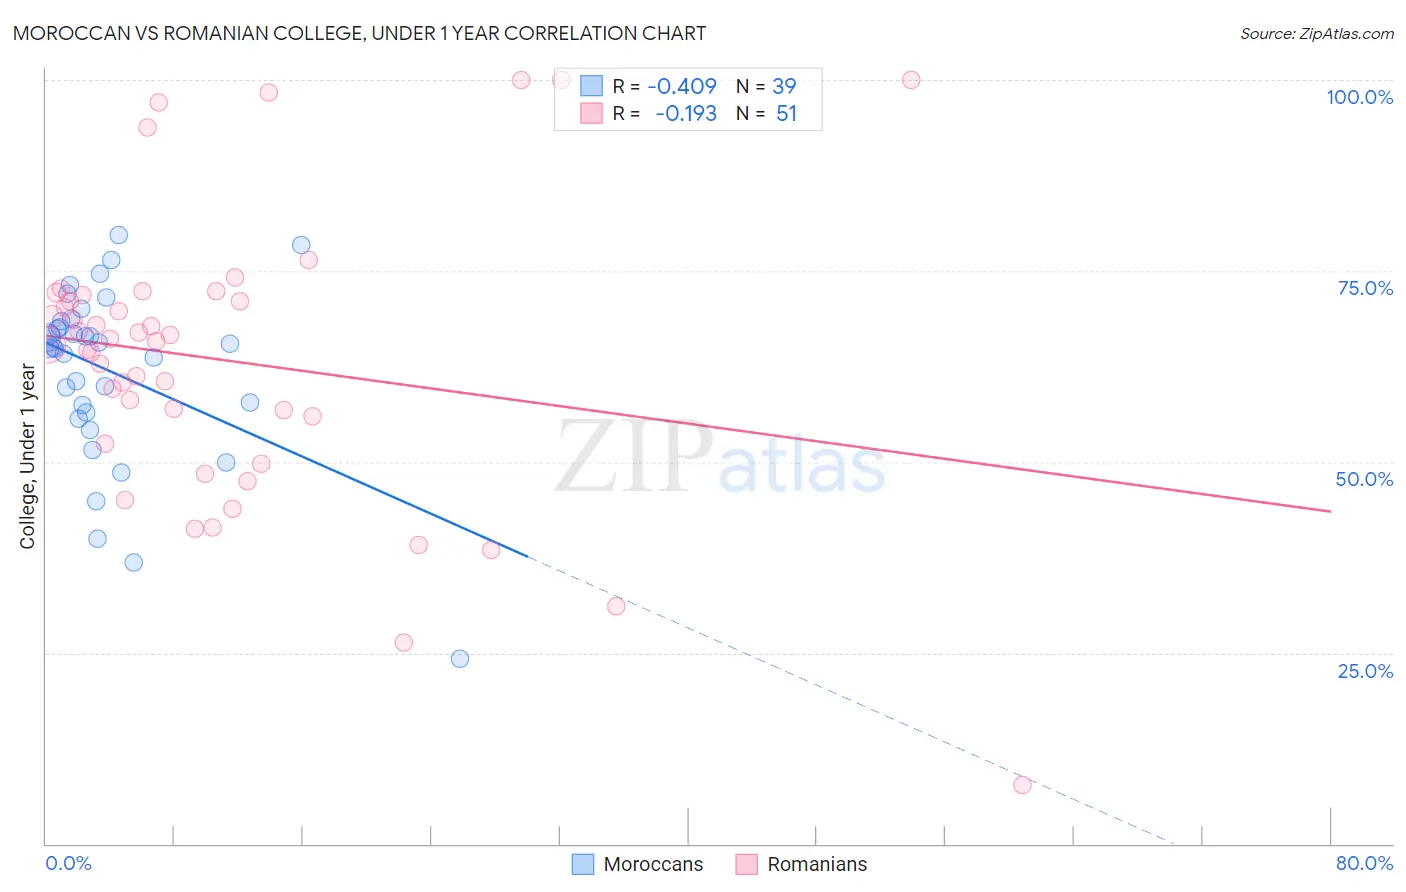
Moroccan vs Romanian College, Under 1 year Correlation Chart

The statistical analysis conducted on geographies consisting of 201,817,667 people shows a moderate negative correlation between the proportion of Moroccans and percentage of population with at least college, under 1 year education in the United States with a correlation coefficient (R) of -0.409 and weighted average of 65.6%. Similarly, the statistical analysis conducted on geographies consisting of 377,903,335 people shows a poor negative correlation between the proportion of Romanians and percentage of population with at least college, under 1 year education in the United States with a correlation coefficient (R) of -0.193 and weighted average of 68.2%, a difference of 3.9%.
Moroccan vs Romanian College, Under 1 year

College, Under 1 year Correlation Summary

MeasurementMoroccanRomanian
Minimum24.2%7.6%
Maximum79.7%100.0%
Range55.5%92.4%
Mean61.8%63.3%
Median64.9%65.8%
Interquartile 25% (IQ1)56.5%52.4%
Interquartile 75% (IQ3)68.4%71.8%
Interquartile Range (IQR)11.9%19.5%
Standard Deviation (Sample)11.6%18.8%
Standard Deviation (Population)11.4%18.7%

Similar Demographics by College, Under 1 year

Demographics Similar to Moroccans by College, Under 1 year

In terms of college, under 1 year, the demographic groups most similar to Moroccans are Immigrants from Somalia (65.6%, a difference of 0.010%), Hungarian (65.6%, a difference of 0.030%), Yugoslavian (65.6%, a difference of 0.040%), German (65.6%, a difference of 0.040%), and Immigrants from Oceania (65.6%, a difference of 0.080%).
DemographicsRating | RankCollege, Under 1 year
Tlingit-Haida
66.4
/100
|
#159
Good
65.9%
Albanians
66.1
/100
|
#160
Good
65.9%
Brazilians
66.0
/100
|
#161
Good
65.9%
Koreans
65.3
/100
|
#162
Good
65.9%
Somalis
62.7
/100
|
#163
Good
65.8%
Czechoslovakians
62.6
/100
|
#164
Good
65.8%
Immigrants | Uzbekistan
61.6
/100
|
#165
Good
65.8%
Moroccans
56.7
/100
|
#166
Average
65.6%
Immigrants | Somalia
56.4
/100
|
#167
Average
65.6%
Hungarians
55.9
/100
|
#168
Average
65.6%
Yugoslavians
55.7
/100
|
#169
Average
65.6%
Germans
55.7
/100
|
#170
Average
65.6%
Immigrants | Oceania
55.0
/100
|
#171
Average
65.6%
South American Indians
54.4
/100
|
#172
Average
65.5%
Swiss
53.9
/100
|
#173
Average
65.5%

Demographics Similar to Romanians by College, Under 1 year

In terms of college, under 1 year, the demographic groups most similar to Romanians are Luxembourger (68.2%, a difference of 0.090%), Armenian (68.1%, a difference of 0.090%), European (68.2%, a difference of 0.10%), Icelander (68.3%, a difference of 0.13%), and Ethiopian (68.3%, a difference of 0.19%).
DemographicsRating | RankCollege, Under 1 year
Immigrants | Lebanon
98.3
/100
|
#86
Exceptional
68.3%
Chinese
98.3
/100
|
#87
Exceptional
68.3%
Croatians
98.2
/100
|
#88
Exceptional
68.3%
Ethiopians
98.2
/100
|
#89
Exceptional
68.3%
Icelanders
98.1
/100
|
#90
Exceptional
68.3%
Europeans
98.1
/100
|
#91
Exceptional
68.2%
Luxembourgers
98.1
/100
|
#92
Exceptional
68.2%
Romanians
97.9
/100
|
#93
Exceptional
68.2%
Armenians
97.7
/100
|
#94
Exceptional
68.1%
Immigrants | Pakistan
97.5
/100
|
#95
Exceptional
68.0%
Jordanians
97.4
/100
|
#96
Exceptional
68.0%
Immigrants | Ethiopia
97.3
/100
|
#97
Exceptional
68.0%
Paraguayans
97.1
/100
|
#98
Exceptional
67.9%
Immigrants | Bolivia
97.0
/100
|
#99
Exceptional
67.9%
Immigrants | Argentina
97.0
/100
|
#100
Exceptional
67.9%