Immigrants from Israel vs Romanian College, Under 1 year

COMPARE

Immigrants from Israel
Race
Ancestry
AfghanAfricanAlaska NativeAlaskan AthabascanAlbanianAleutAlsatianAmericanApacheArabArapahoArgentineanArmenianAssyrian/Chaldean/SyriacAustralianAustrianBahamianBangladeshiBarbadianBasqueBelgianBelizeanBermudanBhutaneseBlackfeetBolivianBrazilianBritishBritish West IndianBulgarianBurmeseCajunCambodianCanadianCape VerdeanCarpatho RusynCelticCentral AmericanCentral American IndianCherokeeCheyenneChickasawChileanChineseChippewaChoctawColombianColvilleComancheCosta RicanCreeCreekCroatianCrowCubanCypriotCzechCzechoslovakianDanishDelawareDominicanDutchDutch West IndianEastern EuropeanEcuadorianEgyptianEnglishEstonianEthiopianEuropeanFijianFilipinoFinnishFrenchFrench American IndianFrench CanadianGermanGerman RussianGhanaianGreekGuamanian/ChamorroGuatemalanGuyaneseHaitianHmongHonduranHopiHoumaHungarianIcelanderIndian (Asian)IndonesianInupiatIranianIraqiIrishIroquoisIsraeliItalianJamaicanJapaneseJordanianKenyanKiowaKoreanLaotianLatvianLebaneseLiberianLithuanianLumbeeLuxembourgerMacedonianMalaysianMalteseMarshalleseMenomineeMexicanMexican American IndianMongolianMoroccanNative HawaiianNavajoNepaleseNew ZealanderNicaraguanNigerianNorthern EuropeanNorwegianOkinawanOsageOttawaPaiutePakistaniPalestinianPanamanianParaguayanPennsylvania GermanPeruvianPimaPolishPortuguesePotawatomiPuebloPuerto RicanPuget Sound SalishRussianSalvadoranSamoanScandinavianScotch-IrishScottishSeminoleSenegaleseSerbianShoshoneSierra LeoneanSiouxSlavicSlovakSloveneSomaliSouth AfricanSouth AmericanSouth American IndianSoviet UnionSpaniardSpanishSpanish AmericanSpanish American IndianSri LankanSubsaharan AfricanSudaneseSwedishSwissSyrianTaiwaneseThaiTlingit-HaidaTohono O'OdhamTonganTrinidadian and TobagonianTsimshianTurkishU.S. Virgin IslanderUgandanUkrainianUruguayanUteVenezuelanVietnameseWelshWest IndianYakamaYaquiYugoslavianYumanYup'ikZimbabwean
Immigration
NonimmigrantsImmigrantsAfghanistanAfricaAlbaniaArgentinaArmeniaAsiaAustraliaAustriaBahamasBangladeshBarbadosBelarusBelgiumBelizeBoliviaBosnia and HerzegovinaBrazilBulgariaBurma/MyanmarCabo VerdeCambodiaCameroonCanadaCaribbeanCentral AmericaChileChinaColombiaCongoCosta RicaCroatiaCubaCzechoslovakiaDenmarkDominicaDominican RepublicEastern AfricaEastern AsiaEastern EuropeEcuadorEgyptEl SalvadorEnglandEritreaEthiopiaEuropeFijiFranceGermanyGhanaGreeceGrenadaGuatemalaGuyanaHaitiHondurasHong KongHungaryIndiaIndonesiaIranIraqIrelandIsraelItalyJamaicaJapanJordanKazakhstanKenyaKoreaKuwaitLaosLatin AmericaLatviaLebanonLiberiaLithuaniaMalaysiaMexicoMicronesiaMiddle AfricaMoldovaMoroccoNepalNetherlandsNicaraguaNigeriaNorth AmericaNorth MacedoniaNorthern AfricaNorthern EuropeNorwayOceaniaPakistanPanamaPeruPhilippinesPolandPortugalRomaniaRussiaSaudi ArabiaScotlandSenegalSerbiaSierra LeoneSingaporeSomaliaSouth AfricaSouth AmericaSouth Central AsiaSouth Eastern AsiaSouthern EuropeSpainSri LankaSt. Vincent and the GrenadinesSudanSwedenSwitzerlandSyriaTaiwanThailandTrinidad and TobagoTurkeyUgandaUkraineUruguayUzbekistanVenezuelaVietnamWest IndiesWestern AfricaWestern AsiaWestern EuropeYemenZaireZimbabweAzores
Romanian
Race
Ancestry
AfghanAfricanAlaska NativeAlaskan AthabascanAlbanianAleutAlsatianAmericanApacheArabArapahoArgentineanArmenianAssyrian/Chaldean/SyriacAustralianAustrianBahamianBangladeshiBarbadianBasqueBelgianBelizeanBermudanBhutaneseBlackfeetBolivianBrazilianBritishBritish West IndianBulgarianBurmeseCajunCambodianCanadianCape VerdeanCarpatho RusynCelticCentral AmericanCentral American IndianCherokeeCheyenneChickasawChileanChineseChippewaChoctawColombianColvilleComancheCosta RicanCreeCreekCroatianCrowCubanCypriotCzechCzechoslovakianDanishDelawareDominicanDutchDutch West IndianEastern EuropeanEcuadorianEgyptianEnglishEstonianEthiopianEuropeanFijianFilipinoFinnishFrenchFrench American IndianFrench CanadianGermanGerman RussianGhanaianGreekGuamanian/ChamorroGuatemalanGuyaneseHaitianHmongHonduranHopiHoumaHungarianIcelanderIndian (Asian)IndonesianInupiatIranianIraqiIrishIroquoisIsraeliItalianJamaicanJapaneseJordanianKenyanKiowaKoreanLaotianLatvianLebaneseLiberianLithuanianLumbeeLuxembourgerMacedonianMalaysianMalteseMarshalleseMenomineeMexicanMexican American IndianMongolianMoroccanNative HawaiianNavajoNepaleseNew ZealanderNicaraguanNigerianNorthern EuropeanNorwegianOkinawanOsageOttawaPaiutePakistaniPalestinianPanamanianParaguayanPennsylvania GermanPeruvianPimaPolishPortuguesePotawatomiPuebloPuerto RicanPuget Sound SalishRomanianRussianSalvadoranSamoanScandinavianScotch-IrishScottishSeminoleSenegaleseSerbianShoshoneSierra LeoneanSiouxSlavicSlovakSloveneSomaliSouth AfricanSouth AmericanSouth American IndianSoviet UnionSpaniardSpanishSpanish AmericanSpanish American IndianSri LankanSubsaharan AfricanSudaneseSwedishSwissSyrianTaiwaneseThaiTlingit-HaidaTohono O'OdhamTonganTrinidadian and TobagonianTsimshianTurkishU.S. Virgin IslanderUgandanUkrainianUruguayanUteVenezuelanVietnameseWelshWest IndianYakamaYaquiYugoslavianYumanYup'ikZimbabwean
Immigration
NonimmigrantsImmigrantsAfghanistanAfricaAlbaniaArgentinaArmeniaAsiaAustraliaAustriaBahamasBangladeshBarbadosBelarusBelgiumBelizeBoliviaBosnia and HerzegovinaBrazilBulgariaBurma/MyanmarCabo VerdeCambodiaCameroonCanadaCaribbeanCentral AmericaChileChinaColombiaCongoCosta RicaCroatiaCubaCzechoslovakiaDenmarkDominicaDominican RepublicEastern AfricaEastern AsiaEastern EuropeEcuadorEgyptEl SalvadorEnglandEritreaEthiopiaEuropeFijiFranceGermanyGhanaGreeceGrenadaGuatemalaGuyanaHaitiHondurasHong KongHungaryIndiaIndonesiaIranIraqIrelandItalyJamaicaJapanJordanKazakhstanKenyaKoreaKuwaitLaosLatin AmericaLatviaLebanonLiberiaLithuaniaMalaysiaMexicoMicronesiaMiddle AfricaMoldovaMoroccoNepalNetherlandsNicaraguaNigeriaNorth AmericaNorth MacedoniaNorthern AfricaNorthern EuropeNorwayOceaniaPakistanPanamaPeruPhilippinesPolandPortugalRomaniaRussiaSaudi ArabiaScotlandSenegalSerbiaSierra LeoneSingaporeSomaliaSouth AfricaSouth AmericaSouth Central AsiaSouth Eastern AsiaSouthern EuropeSpainSri LankaSt. Vincent and the GrenadinesSudanSwedenSwitzerlandSyriaTaiwanThailandTrinidad and TobagoTurkeyUgandaUkraineUruguayUzbekistanVenezuelaVietnamWest IndiesWestern AfricaWestern AsiaWestern EuropeYemenZaireZimbabweAzores
College, Under 1 year
Income
Poverty
Unemployment
Labor Participation
Family Structure
Vehicle Availability
Education Level
Disability

College, Under 1 year Comparison

Immigrants from Israel

Romanians

Exceptional
Exceptional
72.3%
COLLEGE, UNDER 1 YEAR
100.0/ 100
METRIC RATING
10th/ 347
METRIC RANK
68.2%
COLLEGE, UNDER 1 YEAR
97.9/ 100
METRIC RATING
93rd/ 347
METRIC RANK

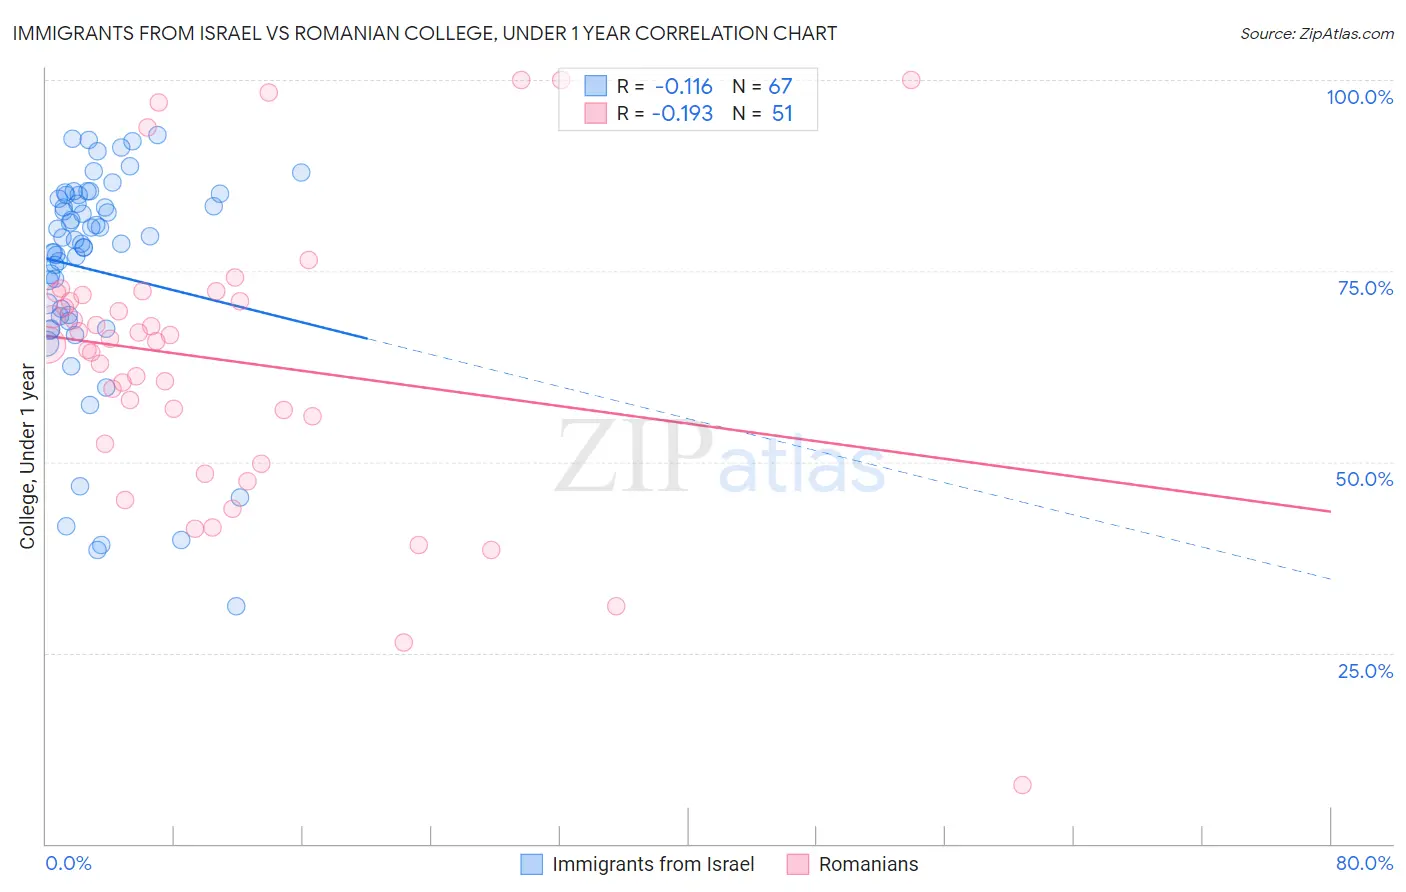
Immigrants from Israel vs Romanian College, Under 1 year Correlation Chart

The statistical analysis conducted on geographies consisting of 210,030,735 people shows a poor negative correlation between the proportion of Immigrants from Israel and percentage of population with at least college, under 1 year education in the United States with a correlation coefficient (R) of -0.116 and weighted average of 72.3%. Similarly, the statistical analysis conducted on geographies consisting of 377,903,335 people shows a poor negative correlation between the proportion of Romanians and percentage of population with at least college, under 1 year education in the United States with a correlation coefficient (R) of -0.193 and weighted average of 68.2%, a difference of 6.0%.
Immigrants from Israel vs Romanian College, Under 1 year

College, Under 1 year Correlation Summary

MeasurementImmigrants from IsraelRomanian
Minimum31.0%7.6%
Maximum92.7%100.0%
Range61.7%92.4%
Mean75.1%63.3%
Median79.1%65.8%
Interquartile 25% (IQ1)69.0%52.4%
Interquartile 75% (IQ3)84.9%71.8%
Interquartile Range (IQR)15.8%19.5%
Standard Deviation (Sample)14.4%18.8%
Standard Deviation (Population)14.3%18.7%

Similar Demographics by College, Under 1 year

Demographics Similar to Immigrants from Israel by College, Under 1 year

In terms of college, under 1 year, the demographic groups most similar to Immigrants from Israel are Immigrants from South Central Asia (72.1%, a difference of 0.30%), Immigrants from Sweden (72.1%, a difference of 0.30%), Cypriot (72.0%, a difference of 0.46%), Cambodian (71.9%, a difference of 0.58%), and Burmese (71.9%, a difference of 0.58%).
DemographicsRating | RankCollege, Under 1 year
Immigrants | Singapore
100.0
/100
|
#3
Exceptional
74.8%
Immigrants | India
100.0
/100
|
#4
Exceptional
74.4%
Immigrants | Iran
100.0
/100
|
#5
Exceptional
74.3%
Immigrants | Taiwan
100.0
/100
|
#6
Exceptional
74.2%
Okinawans
100.0
/100
|
#7
Exceptional
73.7%
Thais
100.0
/100
|
#8
Exceptional
73.4%
Immigrants | Australia
100.0
/100
|
#9
Exceptional
72.7%
Immigrants | Israel
100.0
/100
|
#10
Exceptional
72.3%
Immigrants | South Central Asia
100.0
/100
|
#11
Exceptional
72.1%
Immigrants | Sweden
100.0
/100
|
#12
Exceptional
72.1%
Cypriots
100.0
/100
|
#13
Exceptional
72.0%
Cambodians
100.0
/100
|
#14
Exceptional
71.9%
Burmese
100.0
/100
|
#15
Exceptional
71.9%
Immigrants | Japan
100.0
/100
|
#16
Exceptional
71.9%
Eastern Europeans
100.0
/100
|
#17
Exceptional
71.8%

Demographics Similar to Romanians by College, Under 1 year

In terms of college, under 1 year, the demographic groups most similar to Romanians are Luxembourger (68.2%, a difference of 0.090%), Armenian (68.1%, a difference of 0.090%), European (68.2%, a difference of 0.10%), Icelander (68.3%, a difference of 0.13%), and Ethiopian (68.3%, a difference of 0.19%).
DemographicsRating | RankCollege, Under 1 year
Immigrants | Lebanon
98.3
/100
|
#86
Exceptional
68.3%
Chinese
98.3
/100
|
#87
Exceptional
68.3%
Croatians
98.2
/100
|
#88
Exceptional
68.3%
Ethiopians
98.2
/100
|
#89
Exceptional
68.3%
Icelanders
98.1
/100
|
#90
Exceptional
68.3%
Europeans
98.1
/100
|
#91
Exceptional
68.2%
Luxembourgers
98.1
/100
|
#92
Exceptional
68.2%
Romanians
97.9
/100
|
#93
Exceptional
68.2%
Armenians
97.7
/100
|
#94
Exceptional
68.1%
Immigrants | Pakistan
97.5
/100
|
#95
Exceptional
68.0%
Jordanians
97.4
/100
|
#96
Exceptional
68.0%
Immigrants | Ethiopia
97.3
/100
|
#97
Exceptional
68.0%
Paraguayans
97.1
/100
|
#98
Exceptional
67.9%
Immigrants | Bolivia
97.0
/100
|
#99
Exceptional
67.9%
Immigrants | Argentina
97.0
/100
|
#100
Exceptional
67.9%