Immigrants from Brazil vs Immigrants from Argentina College, Under 1 year
COMPARE
Immigrants from Brazil
Immigrants from Argentina
College, Under 1 year
College, Under 1 year Comparison
Immigrants from Brazil
Immigrants from Argentina
66.9%
COLLEGE, UNDER 1 YEAR
88.3/ 100
METRIC RATING
133rd/ 347
METRIC RANK
67.9%
COLLEGE, UNDER 1 YEAR
97.0/ 100
METRIC RATING
100th/ 347
METRIC RANK
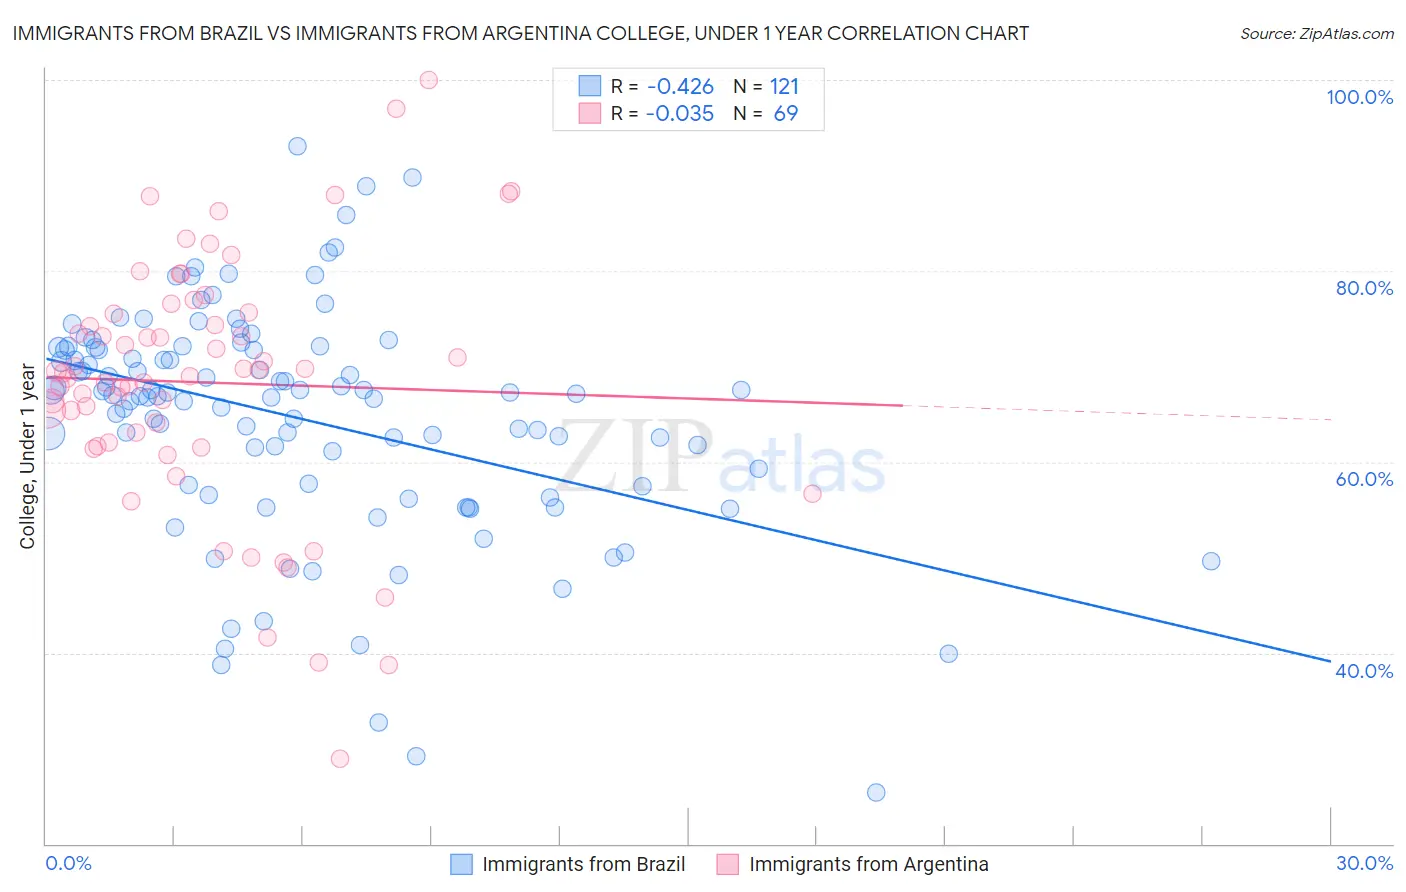
Immigrants from Brazil vs Immigrants from Argentina College, Under 1 year Correlation Chart
The statistical analysis conducted on geographies consisting of 343,021,697 people shows a moderate negative correlation between the proportion of Immigrants from Brazil and percentage of population with at least college, under 1 year education in the United States with a correlation coefficient (R) of -0.426 and weighted average of 66.9%. Similarly, the statistical analysis conducted on geographies consisting of 264,437,906 people shows no correlation between the proportion of Immigrants from Argentina and percentage of population with at least college, under 1 year education in the United States with a correlation coefficient (R) of -0.035 and weighted average of 67.9%, a difference of 1.6%.
College, Under 1 year Correlation Summary
| Measurement | Immigrants from Brazil | Immigrants from Argentina |
| Minimum | 25.4% | 29.0% |
| Maximum | 93.0% | 100.0% |
| Range | 67.7% | 71.0% |
| Mean | 64.6% | 68.3% |
| Median | 67.0% | 69.3% |
| Interquartile 25% (IQ1) | 57.5% | 61.9% |
| Interquartile 75% (IQ3) | 71.9% | 75.6% |
| Interquartile Range (IQR) | 14.4% | 13.7% |
| Standard Deviation (Sample) | 12.0% | 13.4% |
| Standard Deviation (Population) | 11.9% | 13.3% |
Similar Demographics by College, Under 1 year
Demographics Similar to Immigrants from Brazil by College, Under 1 year
In terms of college, under 1 year, the demographic groups most similar to Immigrants from Brazil are Polish (66.9%, a difference of 0.010%), Finnish (66.9%, a difference of 0.030%), Iraqi (66.8%, a difference of 0.030%), Canadian (66.8%, a difference of 0.040%), and Ugandan (66.8%, a difference of 0.050%).
| Demographics | Rating | Rank | College, Under 1 year |
| Alsatians | 91.3 /100 | #126 | Exceptional 67.1% |
| Czechs | 90.8 /100 | #127 | Exceptional 67.1% |
| Scottish | 90.2 /100 | #128 | Exceptional 67.0% |
| Immigrants | Eastern Africa | 89.5 /100 | #129 | Excellent 67.0% |
| Immigrants | Syria | 89.0 /100 | #130 | Excellent 66.9% |
| Finns | 88.6 /100 | #131 | Excellent 66.9% |
| Poles | 88.4 /100 | #132 | Excellent 66.9% |
| Immigrants | Brazil | 88.3 /100 | #133 | Excellent 66.9% |
| Iraqis | 88.0 /100 | #134 | Excellent 66.8% |
| Canadians | 87.9 /100 | #135 | Excellent 66.8% |
| Ugandans | 87.8 /100 | #136 | Excellent 66.8% |
| Immigrants | Chile | 87.4 /100 | #137 | Excellent 66.8% |
| Immigrants | Italy | 86.9 /100 | #138 | Excellent 66.8% |
| Venezuelans | 85.9 /100 | #139 | Excellent 66.7% |
| Slavs | 85.9 /100 | #140 | Excellent 66.7% |
Demographics Similar to Immigrants from Argentina by College, Under 1 year
In terms of college, under 1 year, the demographic groups most similar to Immigrants from Argentina are Immigrants from Bolivia (67.9%, a difference of 0.010%), Paraguayan (67.9%, a difference of 0.030%), Immigrants from Eastern Europe (67.9%, a difference of 0.050%), Palestinian (67.9%, a difference of 0.050%), and Carpatho Rusyn (67.9%, a difference of 0.060%).
| Demographics | Rating | Rank | College, Under 1 year |
| Romanians | 97.9 /100 | #93 | Exceptional 68.2% |
| Armenians | 97.7 /100 | #94 | Exceptional 68.1% |
| Immigrants | Pakistan | 97.5 /100 | #95 | Exceptional 68.0% |
| Jordanians | 97.4 /100 | #96 | Exceptional 68.0% |
| Immigrants | Ethiopia | 97.3 /100 | #97 | Exceptional 68.0% |
| Paraguayans | 97.1 /100 | #98 | Exceptional 67.9% |
| Immigrants | Bolivia | 97.0 /100 | #99 | Exceptional 67.9% |
| Immigrants | Argentina | 97.0 /100 | #100 | Exceptional 67.9% |
| Immigrants | Eastern Europe | 96.9 /100 | #101 | Exceptional 67.9% |
| Palestinians | 96.9 /100 | #102 | Exceptional 67.9% |
| Carpatho Rusyns | 96.8 /100 | #103 | Exceptional 67.9% |
| Immigrants | Western Asia | 96.6 /100 | #104 | Exceptional 67.8% |
| Afghans | 96.6 /100 | #105 | Exceptional 67.8% |
| Immigrants | Croatia | 96.6 /100 | #106 | Exceptional 67.8% |
| Austrians | 96.4 /100 | #107 | Exceptional 67.8% |