Immigrants from Argentina vs Hispanic or Latino College, 1 year or more

COMPARE

Immigrants from Argentina
Race
Ancestry
AfghanAfricanAlaska NativeAlaskan AthabascanAlbanianAleutAlsatianAmericanApacheArabArapahoArgentineanArmenianAssyrian/Chaldean/SyriacAustralianAustrianBahamianBangladeshiBarbadianBasqueBelgianBelizeanBermudanBhutaneseBlackfeetBolivianBrazilianBritishBritish West IndianBulgarianBurmeseCajunCambodianCanadianCape VerdeanCarpatho RusynCelticCentral AmericanCentral American IndianCherokeeCheyenneChickasawChileanChineseChippewaChoctawColombianColvilleComancheCosta RicanCreeCreekCroatianCrowCubanCypriotCzechCzechoslovakianDanishDelawareDominicanDutchDutch West IndianEastern EuropeanEcuadorianEgyptianEnglishEstonianEthiopianEuropeanFijianFilipinoFinnishFrenchFrench American IndianFrench CanadianGermanGerman RussianGhanaianGreekGuamanian/ChamorroGuatemalanGuyaneseHaitianHmongHonduranHopiHoumaHungarianIcelanderIndian (Asian)IndonesianInupiatIranianIraqiIrishIroquoisIsraeliItalianJamaicanJapaneseJordanianKenyanKiowaKoreanLaotianLatvianLebaneseLiberianLithuanianLumbeeLuxembourgerMacedonianMalaysianMalteseMarshalleseMenomineeMexicanMexican American IndianMongolianMoroccanNative HawaiianNavajoNepaleseNew ZealanderNicaraguanNigerianNorthern EuropeanNorwegianOkinawanOsageOttawaPaiutePakistaniPalestinianPanamanianParaguayanPennsylvania GermanPeruvianPimaPolishPortuguesePotawatomiPuebloPuerto RicanPuget Sound SalishRomanianRussianSalvadoranSamoanScandinavianScotch-IrishScottishSeminoleSenegaleseSerbianShoshoneSierra LeoneanSiouxSlavicSlovakSloveneSomaliSouth AfricanSouth AmericanSouth American IndianSoviet UnionSpaniardSpanishSpanish AmericanSpanish American IndianSri LankanSubsaharan AfricanSudaneseSwedishSwissSyrianTaiwaneseThaiTlingit-HaidaTohono O'OdhamTonganTrinidadian and TobagonianTsimshianTurkishU.S. Virgin IslanderUgandanUkrainianUruguayanUteVenezuelanVietnameseWelshWest IndianYakamaYaquiYugoslavianYumanYup'ikZimbabwean
Immigration
NonimmigrantsImmigrantsAfghanistanAfricaAlbaniaArgentinaArmeniaAsiaAustraliaAustriaBahamasBangladeshBarbadosBelarusBelgiumBelizeBoliviaBosnia and HerzegovinaBrazilBulgariaBurma/MyanmarCabo VerdeCambodiaCameroonCanadaCaribbeanCentral AmericaChileChinaColombiaCongoCosta RicaCroatiaCubaCzechoslovakiaDenmarkDominicaDominican RepublicEastern AfricaEastern AsiaEastern EuropeEcuadorEgyptEl SalvadorEnglandEritreaEthiopiaEuropeFijiFranceGermanyGhanaGreeceGrenadaGuatemalaGuyanaHaitiHondurasHong KongHungaryIndiaIndonesiaIranIraqIrelandIsraelItalyJamaicaJapanJordanKazakhstanKenyaKoreaKuwaitLaosLatin AmericaLatviaLebanonLiberiaLithuaniaMalaysiaMexicoMicronesiaMiddle AfricaMoldovaMoroccoNepalNetherlandsNicaraguaNigeriaNorth AmericaNorth MacedoniaNorthern AfricaNorthern EuropeNorwayOceaniaPakistanPanamaPeruPhilippinesPolandPortugalRomaniaRussiaSaudi ArabiaScotlandSenegalSerbiaSierra LeoneSingaporeSomaliaSouth AfricaSouth AmericaSouth Central AsiaSouth Eastern AsiaSouthern EuropeSpainSri LankaSt. Vincent and the GrenadinesSudanSwedenSwitzerlandSyriaTaiwanThailandTrinidad and TobagoTurkeyUgandaUkraineUruguayUzbekistanVenezuelaVietnamWest IndiesWestern AfricaWestern AsiaWestern EuropeYemenZaireZimbabweAzores
Hispanic or Latino
Race
Ancestry
AfghanAfricanAlaska NativeAlaskan AthabascanAlbanianAleutAlsatianAmericanApacheArabArapahoArgentineanArmenianAssyrian/Chaldean/SyriacAustralianAustrianBahamianBangladeshiBarbadianBasqueBelgianBelizeanBermudanBhutaneseBlackfeetBolivianBrazilianBritishBritish West IndianBulgarianBurmeseCajunCambodianCanadianCape VerdeanCarpatho RusynCelticCentral AmericanCentral American IndianCherokeeCheyenneChickasawChileanChineseChippewaChoctawColombianColvilleComancheCosta RicanCreeCreekCroatianCrowCubanCypriotCzechCzechoslovakianDanishDelawareDominicanDutchDutch West IndianEastern EuropeanEcuadorianEgyptianEnglishEstonianEthiopianEuropeanFijianFilipinoFinnishFrenchFrench American IndianFrench CanadianGermanGerman RussianGhanaianGreekGuamanian/ChamorroGuatemalanGuyaneseHaitianHmongHonduranHopiHoumaHungarianIcelanderIndian (Asian)IndonesianInupiatIranianIraqiIrishIroquoisIsraeliItalianJamaicanJapaneseJordanianKenyanKiowaKoreanLaotianLatvianLebaneseLiberianLithuanianLumbeeLuxembourgerMacedonianMalaysianMalteseMarshalleseMenomineeMexicanMexican American IndianMongolianMoroccanNative HawaiianNavajoNepaleseNew ZealanderNicaraguanNigerianNorthern EuropeanNorwegianOkinawanOsageOttawaPaiutePakistaniPalestinianPanamanianParaguayanPennsylvania GermanPeruvianPimaPolishPortuguesePotawatomiPuebloPuerto RicanPuget Sound SalishRomanianRussianSalvadoranSamoanScandinavianScotch-IrishScottishSeminoleSenegaleseSerbianShoshoneSierra LeoneanSiouxSlavicSlovakSloveneSomaliSouth AfricanSouth AmericanSouth American IndianSoviet UnionSpaniardSpanishSpanish AmericanSpanish American IndianSri LankanSubsaharan AfricanSudaneseSwedishSwissSyrianTaiwaneseThaiTlingit-HaidaTohono O'OdhamTonganTrinidadian and TobagonianTsimshianTurkishU.S. Virgin IslanderUgandanUkrainianUruguayanUteVenezuelanVietnameseWelshWest IndianYakamaYaquiYugoslavianYumanYup'ikZimbabwean
Immigration
NonimmigrantsImmigrantsAfghanistanAfricaAlbaniaArmeniaAsiaAustraliaAustriaBahamasBangladeshBarbadosBelarusBelgiumBelizeBoliviaBosnia and HerzegovinaBrazilBulgariaBurma/MyanmarCabo VerdeCambodiaCameroonCanadaCaribbeanCentral AmericaChileChinaColombiaCongoCosta RicaCroatiaCubaCzechoslovakiaDenmarkDominicaDominican RepublicEastern AfricaEastern AsiaEastern EuropeEcuadorEgyptEl SalvadorEnglandEritreaEthiopiaEuropeFijiFranceGermanyGhanaGreeceGrenadaGuatemalaGuyanaHaitiHondurasHong KongHungaryIndiaIndonesiaIranIraqIrelandIsraelItalyJamaicaJapanJordanKazakhstanKenyaKoreaKuwaitLaosLatin AmericaLatviaLebanonLiberiaLithuaniaMalaysiaMexicoMicronesiaMiddle AfricaMoldovaMoroccoNepalNetherlandsNicaraguaNigeriaNorth AmericaNorth MacedoniaNorthern AfricaNorthern EuropeNorwayOceaniaPakistanPanamaPeruPhilippinesPolandPortugalRomaniaRussiaSaudi ArabiaScotlandSenegalSerbiaSierra LeoneSingaporeSomaliaSouth AfricaSouth AmericaSouth Central AsiaSouth Eastern AsiaSouthern EuropeSpainSri LankaSt. Vincent and the GrenadinesSudanSwedenSwitzerlandSyriaTaiwanThailandTrinidad and TobagoTurkeyUgandaUkraineUruguayUzbekistanVenezuelaVietnamWest IndiesWestern AfricaWestern AsiaWestern EuropeYemenZaireZimbabweAzores
College, 1 year or more
Income
Poverty
Unemployment
Labor Participation
Family Structure
Vehicle Availability
Education Level
Disability

College, 1 year or more Comparison

Immigrants from Argentina

Hispanics or Latinos

Exceptional
Tragic
62.8%
COLLEGE, 1 YEAR OR MORE
98.6/ 100
METRIC RATING
83rd/ 347
METRIC RANK
51.1%
COLLEGE, 1 YEAR OR MORE
0.0/ 100
METRIC RATING
317th/ 347
METRIC RANK

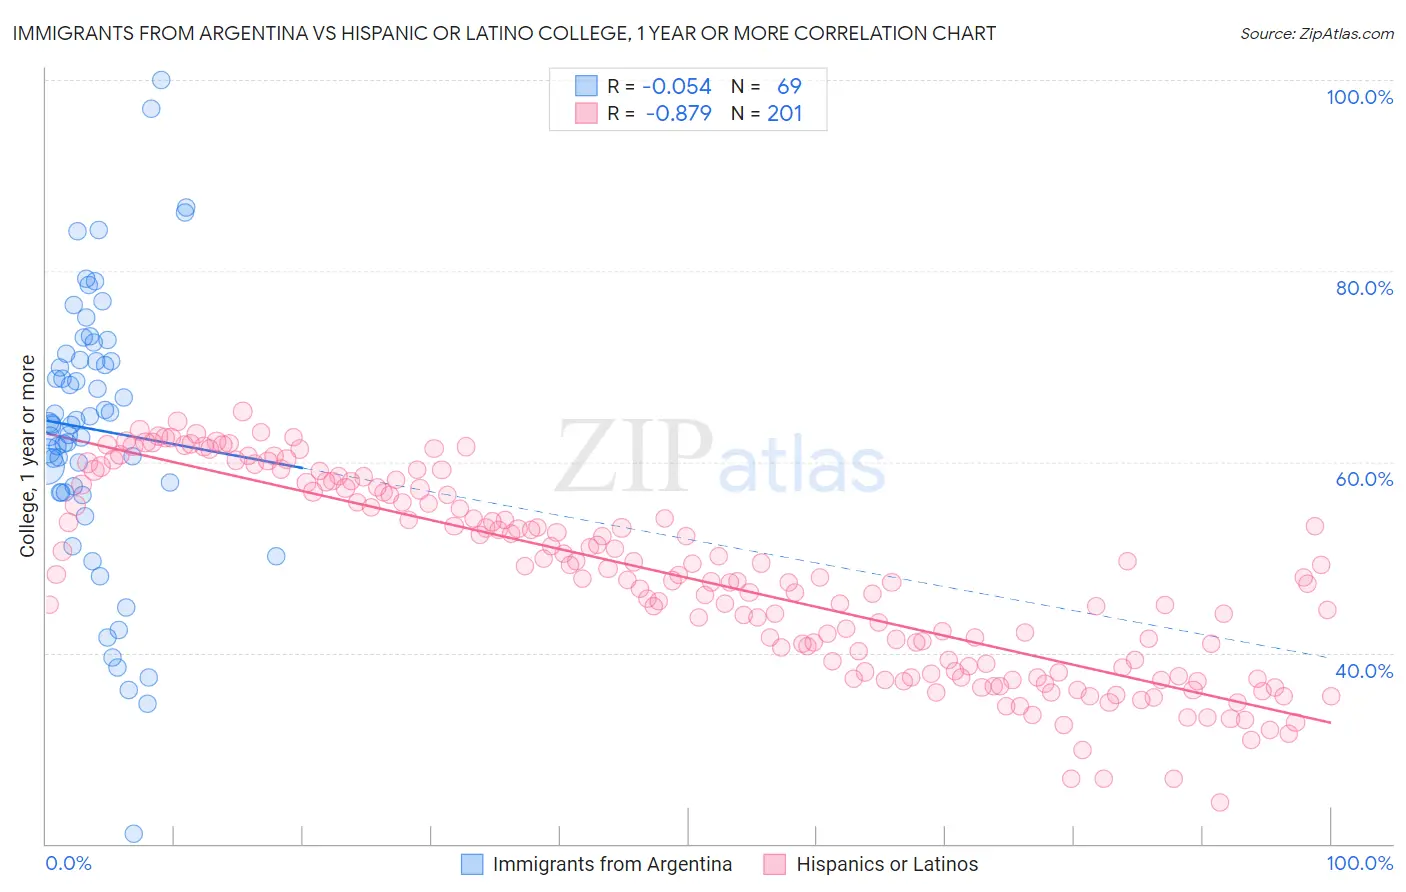
Immigrants from Argentina vs Hispanic or Latino College, 1 year or more Correlation Chart

The statistical analysis conducted on geographies consisting of 264,437,906 people shows a slight negative correlation between the proportion of Immigrants from Argentina and percentage of population with at least college, 1 year or more education in the United States with a correlation coefficient (R) of -0.054 and weighted average of 62.8%. Similarly, the statistical analysis conducted on geographies consisting of 578,586,619 people shows a very strong negative correlation between the proportion of Hispanics or Latinos and percentage of population with at least college, 1 year or more education in the United States with a correlation coefficient (R) of -0.879 and weighted average of 51.1%, a difference of 22.8%.
Immigrants from Argentina vs Hispanic or Latino College, 1 year or more

College, 1 year or more Correlation Summary

MeasurementImmigrants from ArgentinaHispanic or Latino
Minimum21.0%24.4%
Maximum100.0%65.3%
Range79.0%40.9%
Mean63.4%47.8%
Median64.0%47.8%
Interquartile 25% (IQ1)56.8%38.2%
Interquartile 75% (IQ3)71.0%57.0%
Interquartile Range (IQR)14.2%18.8%
Standard Deviation (Sample)14.4%10.0%
Standard Deviation (Population)14.3%10.0%

Similar Demographics by College, 1 year or more

Demographics Similar to Immigrants from Argentina by College, 1 year or more

In terms of college, 1 year or more, the demographic groups most similar to Immigrants from Argentina are Immigrants from England (62.8%, a difference of 0.030%), Immigrants from Bolivia (62.8%, a difference of 0.040%), Immigrants from Pakistan (62.8%, a difference of 0.040%), Immigrants from Western Europe (62.7%, a difference of 0.060%), and Laotian (62.8%, a difference of 0.080%).
DemographicsRating | RankCollege, 1 year or more
Paraguayans
98.8
/100
|
#76
Exceptional
62.9%
Ethiopians
98.8
/100
|
#77
Exceptional
62.9%
Immigrants | Lebanon
98.8
/100
|
#78
Exceptional
62.9%
Northern Europeans
98.8
/100
|
#79
Exceptional
62.9%
Lithuanians
98.8
/100
|
#80
Exceptional
62.9%
Laotians
98.7
/100
|
#81
Exceptional
62.8%
Immigrants | Bolivia
98.7
/100
|
#82
Exceptional
62.8%
Immigrants | Argentina
98.6
/100
|
#83
Exceptional
62.8%
Immigrants | England
98.6
/100
|
#84
Exceptional
62.8%
Immigrants | Pakistan
98.6
/100
|
#85
Exceptional
62.8%
Immigrants | Western Europe
98.6
/100
|
#86
Exceptional
62.7%
Immigrants | Hungary
98.6
/100
|
#87
Exceptional
62.7%
Greeks
98.3
/100
|
#88
Exceptional
62.6%
Immigrants | Ethiopia
98.2
/100
|
#89
Exceptional
62.6%
Immigrants | Western Asia
97.9
/100
|
#90
Exceptional
62.5%

Demographics Similar to Hispanics or Latinos by College, 1 year or more

In terms of college, 1 year or more, the demographic groups most similar to Hispanics or Latinos are Cajun (51.2%, a difference of 0.090%), Immigrants from Honduras (51.0%, a difference of 0.13%), Guatemalan (51.2%, a difference of 0.16%), Immigrants from El Salvador (51.0%, a difference of 0.22%), and Kiowa (51.0%, a difference of 0.28%).
DemographicsRating | RankCollege, 1 year or more
Hondurans
0.0
/100
|
#310
Tragic
51.6%
Immigrants | Haiti
0.0
/100
|
#311
Tragic
51.5%
Pueblo
0.0
/100
|
#312
Tragic
51.5%
Immigrants | Caribbean
0.0
/100
|
#313
Tragic
51.4%
Fijians
0.0
/100
|
#314
Tragic
51.3%
Guatemalans
0.0
/100
|
#315
Tragic
51.2%
Cajuns
0.0
/100
|
#316
Tragic
51.2%
Hispanics or Latinos
0.0
/100
|
#317
Tragic
51.1%
Immigrants | Honduras
0.0
/100
|
#318
Tragic
51.0%
Immigrants | El Salvador
0.0
/100
|
#319
Tragic
51.0%
Kiowa
0.0
/100
|
#320
Tragic
51.0%
Hopi
0.0
/100
|
#321
Tragic
50.9%
Navajo
0.0
/100
|
#322
Tragic
50.8%
Immigrants | Guatemala
0.0
/100
|
#323
Tragic
50.7%
Immigrants | Cuba
0.0
/100
|
#324
Tragic
50.7%