Egyptian vs Crow College, Under 1 year

COMPARE

Egyptian
Race
Ancestry
AfghanAfricanAlaska NativeAlaskan AthabascanAlbanianAleutAlsatianAmericanApacheArabArapahoArgentineanArmenianAssyrian/Chaldean/SyriacAustralianAustrianBahamianBangladeshiBarbadianBasqueBelgianBelizeanBermudanBhutaneseBlackfeetBolivianBrazilianBritishBritish West IndianBulgarianBurmeseCajunCambodianCanadianCape VerdeanCarpatho RusynCelticCentral AmericanCentral American IndianCherokeeCheyenneChickasawChileanChineseChippewaChoctawColombianColvilleComancheCosta RicanCreeCreekCroatianCubanCypriotCzechCzechoslovakianDanishDelawareDominicanDutchDutch West IndianEastern EuropeanEcuadorianEgyptianEnglishEstonianEthiopianEuropeanFijianFilipinoFinnishFrenchFrench American IndianFrench CanadianGermanGerman RussianGhanaianGreekGuamanian/ChamorroGuatemalanGuyaneseHaitianHmongHonduranHopiHoumaHungarianIcelanderIndian (Asian)IndonesianInupiatIranianIraqiIrishIroquoisIsraeliItalianJamaicanJapaneseJordanianKenyanKiowaKoreanLaotianLatvianLebaneseLiberianLithuanianLumbeeLuxembourgerMacedonianMalaysianMalteseMarshalleseMenomineeMexicanMexican American IndianMongolianMoroccanNative HawaiianNavajoNepaleseNew ZealanderNicaraguanNigerianNorthern EuropeanNorwegianOkinawanOsageOttawaPaiutePakistaniPalestinianPanamanianParaguayanPennsylvania GermanPeruvianPimaPolishPortuguesePotawatomiPuebloPuerto RicanPuget Sound SalishRomanianRussianSalvadoranSamoanScandinavianScotch-IrishScottishSeminoleSenegaleseSerbianShoshoneSierra LeoneanSiouxSlavicSlovakSloveneSomaliSouth AfricanSouth AmericanSouth American IndianSoviet UnionSpaniardSpanishSpanish AmericanSpanish American IndianSri LankanSubsaharan AfricanSudaneseSwedishSwissSyrianTaiwaneseThaiTlingit-HaidaTohono O'OdhamTonganTrinidadian and TobagonianTsimshianTurkishU.S. Virgin IslanderUgandanUkrainianUruguayanUteVenezuelanVietnameseWelshWest IndianYakamaYaquiYugoslavianYumanYup'ikZimbabwean
Immigration
NonimmigrantsImmigrantsAfghanistanAfricaAlbaniaArgentinaArmeniaAsiaAustraliaAustriaBahamasBangladeshBarbadosBelarusBelgiumBelizeBoliviaBosnia and HerzegovinaBrazilBulgariaBurma/MyanmarCabo VerdeCambodiaCameroonCanadaCaribbeanCentral AmericaChileChinaColombiaCongoCosta RicaCroatiaCubaCzechoslovakiaDenmarkDominicaDominican RepublicEastern AfricaEastern AsiaEastern EuropeEcuadorEgyptEl SalvadorEnglandEritreaEthiopiaEuropeFijiFranceGermanyGhanaGreeceGrenadaGuatemalaGuyanaHaitiHondurasHong KongHungaryIndiaIndonesiaIranIraqIrelandIsraelItalyJamaicaJapanJordanKazakhstanKenyaKoreaKuwaitLaosLatin AmericaLatviaLebanonLiberiaLithuaniaMalaysiaMexicoMicronesiaMiddle AfricaMoldovaMoroccoNepalNetherlandsNicaraguaNigeriaNorth AmericaNorth MacedoniaNorthern AfricaNorthern EuropeNorwayOceaniaPakistanPanamaPeruPhilippinesPolandPortugalRomaniaRussiaSaudi ArabiaScotlandSenegalSerbiaSierra LeoneSingaporeSomaliaSouth AfricaSouth AmericaSouth Central AsiaSouth Eastern AsiaSouthern EuropeSpainSri LankaSt. Vincent and the GrenadinesSudanSwedenSwitzerlandSyriaTaiwanThailandTrinidad and TobagoTurkeyUgandaUkraineUruguayUzbekistanVenezuelaVietnamWest IndiesWestern AfricaWestern AsiaWestern EuropeYemenZaireZimbabweAzores
Crow
Race
Ancestry
AfghanAfricanAlaska NativeAlaskan AthabascanAlbanianAleutAlsatianAmericanApacheArabArapahoArgentineanArmenianAssyrian/Chaldean/SyriacAustralianAustrianBahamianBangladeshiBarbadianBasqueBelgianBelizeanBermudanBhutaneseBlackfeetBolivianBrazilianBritishBritish West IndianBulgarianBurmeseCajunCambodianCanadianCape VerdeanCarpatho RusynCelticCentral AmericanCentral American IndianCherokeeCheyenneChickasawChileanChineseChippewaChoctawColombianColvilleComancheCosta RicanCreeCreekCroatianCrowCubanCypriotCzechCzechoslovakianDanishDelawareDominicanDutchDutch West IndianEastern EuropeanEcuadorianEnglishEstonianEthiopianEuropeanFijianFilipinoFinnishFrenchFrench American IndianFrench CanadianGermanGerman RussianGhanaianGreekGuamanian/ChamorroGuatemalanGuyaneseHaitianHmongHonduranHopiHoumaHungarianIcelanderIndian (Asian)IndonesianInupiatIranianIraqiIrishIroquoisIsraeliItalianJamaicanJapaneseJordanianKenyanKiowaKoreanLaotianLatvianLebaneseLiberianLithuanianLumbeeLuxembourgerMacedonianMalaysianMalteseMarshalleseMenomineeMexicanMexican American IndianMongolianMoroccanNative HawaiianNavajoNepaleseNew ZealanderNicaraguanNigerianNorthern EuropeanNorwegianOkinawanOsageOttawaPaiutePakistaniPalestinianPanamanianParaguayanPennsylvania GermanPeruvianPimaPolishPortuguesePotawatomiPuebloPuerto RicanPuget Sound SalishRomanianRussianSalvadoranSamoanScandinavianScotch-IrishScottishSeminoleSenegaleseSerbianShoshoneSierra LeoneanSiouxSlavicSlovakSloveneSomaliSouth AfricanSouth AmericanSouth American IndianSoviet UnionSpaniardSpanishSpanish AmericanSpanish American IndianSri LankanSubsaharan AfricanSudaneseSwedishSwissSyrianTaiwaneseThaiTlingit-HaidaTohono O'OdhamTonganTrinidadian and TobagonianTsimshianTurkishU.S. Virgin IslanderUgandanUkrainianUruguayanUteVenezuelanVietnameseWelshWest IndianYakamaYaquiYugoslavianYumanYup'ikZimbabwean
Immigration
NonimmigrantsImmigrantsAfghanistanAfricaAlbaniaArgentinaArmeniaAsiaAustraliaAustriaBahamasBangladeshBarbadosBelarusBelgiumBelizeBoliviaBosnia and HerzegovinaBrazilBulgariaBurma/MyanmarCabo VerdeCambodiaCameroonCanadaCaribbeanCentral AmericaChileChinaColombiaCongoCosta RicaCroatiaCubaCzechoslovakiaDenmarkDominicaDominican RepublicEastern AfricaEastern AsiaEastern EuropeEcuadorEgyptEl SalvadorEnglandEritreaEthiopiaEuropeFijiFranceGermanyGhanaGreeceGrenadaGuatemalaGuyanaHaitiHondurasHong KongHungaryIndiaIndonesiaIranIraqIrelandIsraelItalyJamaicaJapanJordanKazakhstanKenyaKoreaKuwaitLaosLatin AmericaLatviaLebanonLiberiaLithuaniaMalaysiaMexicoMicronesiaMiddle AfricaMoldovaMoroccoNepalNetherlandsNicaraguaNigeriaNorth AmericaNorth MacedoniaNorthern AfricaNorthern EuropeNorwayOceaniaPakistanPanamaPeruPhilippinesPolandPortugalRomaniaRussiaSaudi ArabiaScotlandSenegalSerbiaSierra LeoneSingaporeSomaliaSouth AfricaSouth AmericaSouth Central AsiaSouth Eastern AsiaSouthern EuropeSpainSri LankaSt. Vincent and the GrenadinesSudanSwedenSwitzerlandSyriaTaiwanThailandTrinidad and TobagoTurkeyUgandaUkraineUruguayUzbekistanVenezuelaVietnamWest IndiesWestern AfricaWestern AsiaWestern EuropeYemenZaireZimbabweAzores
College, Under 1 year
Income
Poverty
Unemployment
Labor Participation
Family Structure
Vehicle Availability
Education Level
Disability

College, Under 1 year Comparison

Egyptians

Crow

Exceptional
Tragic
68.3%
COLLEGE, UNDER 1 YEAR
98.3/ 100
METRIC RATING
85th/ 347
METRIC RANK
60.2%
COLLEGE, UNDER 1 YEAR
0.1/ 100
METRIC RATING
280th/ 347
METRIC RANK

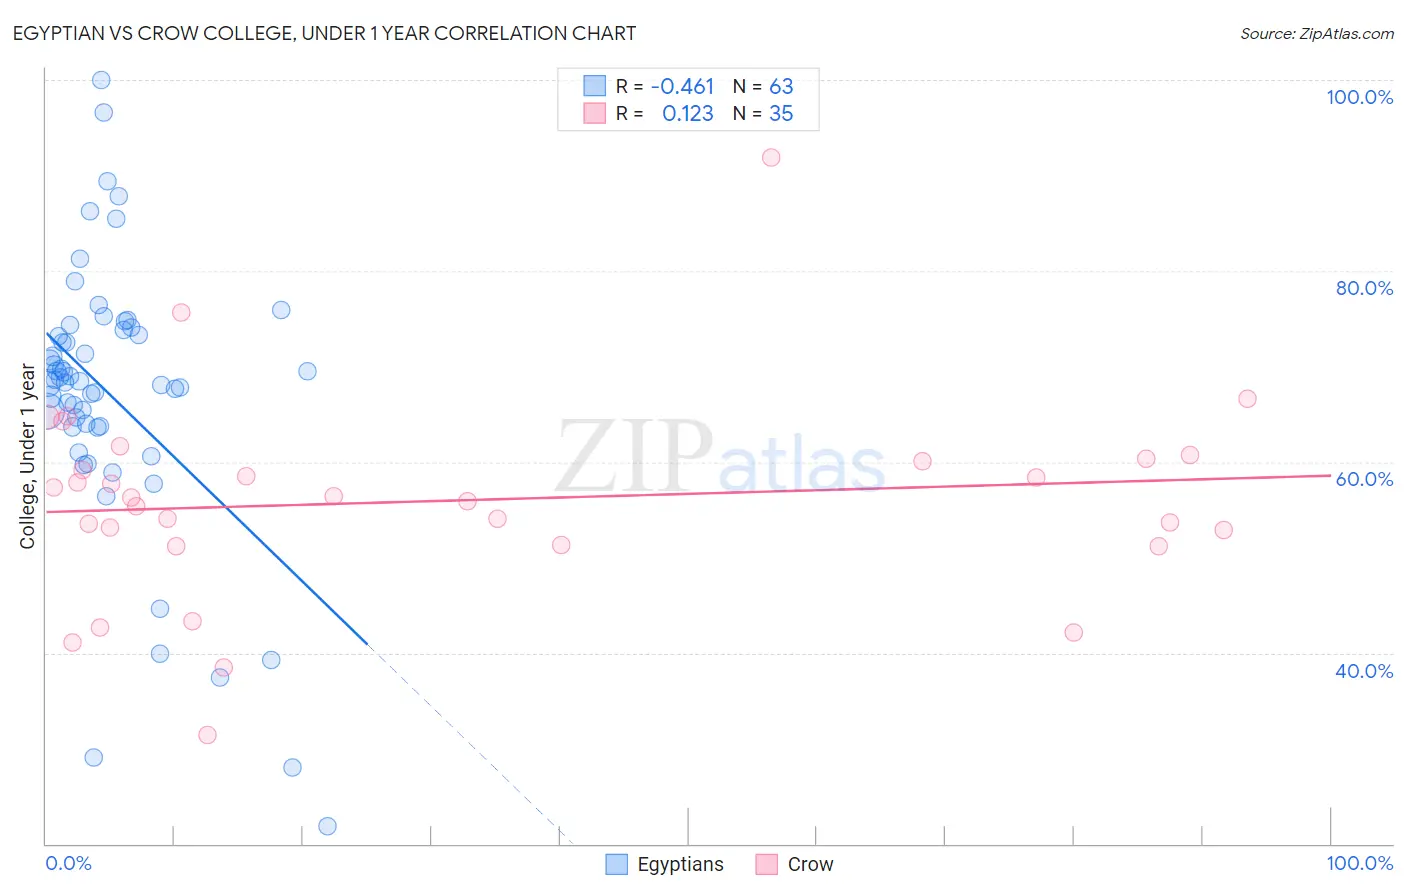
Egyptian vs Crow College, Under 1 year Correlation Chart

The statistical analysis conducted on geographies consisting of 276,927,519 people shows a moderate negative correlation between the proportion of Egyptians and percentage of population with at least college, under 1 year education in the United States with a correlation coefficient (R) of -0.461 and weighted average of 68.3%. Similarly, the statistical analysis conducted on geographies consisting of 59,209,940 people shows a poor positive correlation between the proportion of Crow and percentage of population with at least college, under 1 year education in the United States with a correlation coefficient (R) of 0.123 and weighted average of 60.2%, a difference of 13.6%.
Egyptian vs Crow College, Under 1 year

College, Under 1 year Correlation Summary

MeasurementEgyptianCrow
Minimum21.8%31.4%
Maximum100.0%91.8%
Range78.2%60.4%
Mean66.8%55.9%
Median68.4%56.3%
Interquartile 25% (IQ1)63.7%51.3%
Interquartile 75% (IQ3)73.8%60.3%
Interquartile Range (IQR)10.2%9.1%
Standard Deviation (Sample)14.5%10.7%
Standard Deviation (Population)14.4%10.6%

Similar Demographics by College, Under 1 year

Demographics Similar to Egyptians by College, Under 1 year

In terms of college, under 1 year, the demographic groups most similar to Egyptians are Immigrants from Lebanon (68.3%, a difference of 0.0%), Immigrants from Hungary (68.3%, a difference of 0.010%), Argentinean (68.4%, a difference of 0.030%), Chinese (68.3%, a difference of 0.030%), and Norwegian (68.4%, a difference of 0.040%).
DemographicsRating | RankCollege, Under 1 year
Danes
98.6
/100
|
#78
Exceptional
68.5%
Greeks
98.6
/100
|
#79
Exceptional
68.5%
Immigrants | Spain
98.5
/100
|
#80
Exceptional
68.4%
Immigrants | Greece
98.5
/100
|
#81
Exceptional
68.4%
Norwegians
98.4
/100
|
#82
Exceptional
68.4%
Argentineans
98.4
/100
|
#83
Exceptional
68.4%
Immigrants | Hungary
98.3
/100
|
#84
Exceptional
68.3%
Egyptians
98.3
/100
|
#85
Exceptional
68.3%
Immigrants | Lebanon
98.3
/100
|
#86
Exceptional
68.3%
Chinese
98.3
/100
|
#87
Exceptional
68.3%
Croatians
98.2
/100
|
#88
Exceptional
68.3%
Ethiopians
98.2
/100
|
#89
Exceptional
68.3%
Icelanders
98.1
/100
|
#90
Exceptional
68.3%
Europeans
98.1
/100
|
#91
Exceptional
68.2%
Luxembourgers
98.1
/100
|
#92
Exceptional
68.2%

Demographics Similar to Crow by College, Under 1 year

In terms of college, under 1 year, the demographic groups most similar to Crow are Ute (60.2%, a difference of 0.090%), Yaqui (60.2%, a difference of 0.10%), Cherokee (60.1%, a difference of 0.11%), Bahamian (60.3%, a difference of 0.14%), and Belizean (60.1%, a difference of 0.16%).
DemographicsRating | RankCollege, Under 1 year
Chickasaw
0.1
/100
|
#273
Tragic
60.4%
Alaska Natives
0.1
/100
|
#274
Tragic
60.4%
Immigrants | Barbados
0.1
/100
|
#275
Tragic
60.4%
Arapaho
0.1
/100
|
#276
Tragic
60.3%
Bahamians
0.1
/100
|
#277
Tragic
60.3%
Yaqui
0.1
/100
|
#278
Tragic
60.2%
Ute
0.1
/100
|
#279
Tragic
60.2%
Crow
0.1
/100
|
#280
Tragic
60.2%
Cherokee
0.1
/100
|
#281
Tragic
60.1%
Belizeans
0.1
/100
|
#282
Tragic
60.1%
Immigrants | Jamaica
0.0
/100
|
#283
Tragic
59.7%
Immigrants | St. Vincent and the Grenadines
0.0
/100
|
#284
Tragic
59.6%
Paiute
0.0
/100
|
#285
Tragic
59.6%
British West Indians
0.0
/100
|
#286
Tragic
59.5%
Sioux
0.0
/100
|
#287
Tragic
59.4%